Statistics is the discipline of collecting, organising and analysing data, and using it to draw conclusions while accounting for uncertainty. In finance, that includes deciding which trades belong in a dataset, describing their outcomes and assessing what those observations can tell us about an investment process.
The word also has a narrower use: statistics are numerical summaries calculated from observed data. A sample mean is a statistic; statistics as a discipline asks whether that mean answers the question we actually care about.
What five trades can tell us
Suppose a researcher records the following synthetic net trade outcomes over a common holding period, measured in basis points of each trade's initial notional:
Treat each trade equally, and suppose fees and execution costs are already included. One basis point is 0.01 percentage points. These are five observations, not five possible outcomes with known probabilities.
Their arithmetic mean is
Their median, the middle observation after sorting, is 1 bp. Both are correct: the mean allocates the total equally across observations; the median locates the middle by rank. Neither reports how dispersed the outcomes are. The observed values range from −2 to 10 bps, a span of 12 bps.
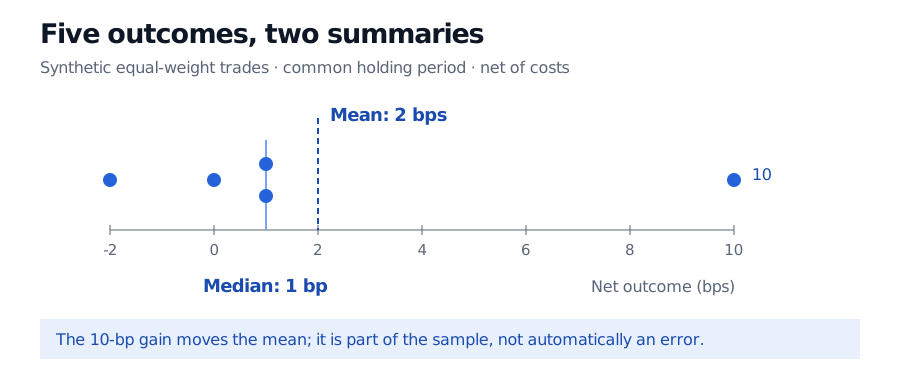
Original synthetic example. Each filled dot is one equally weighted, same-horizon net trade outcome; repeated values are stacked. The large gain affects the mean more than the median.
The 10-bp gain pulls the mean above the middle observation. Removing it would leave a mean of 0 bps and a median of 0.5 bp, but deletion would change the question being answered. A large observation may be a genuine rare gain, an unusual market regime or a recording mistake. Investigate its provenance before labelling it an outlier to discard. A strategy that earns through occasional large wins cannot be understood by quietly removing those wins.
The 2-bp figure is an average trade outcome on the stated basis. It is not a compounded portfolio return: trade sizes, overlapping exposure and capital usage would be needed to establish that.
Description ends where the claim goes beyond the data
Descriptive statistics summarise what was observed. Computing the five-trade mean does not require normality or independence. It requires well-defined measurements and the chosen weighting rule.
Statistical inference uses observations to learn about a wider population or data-generating process. The sample mean of 2 bps is not automatically the strategy's future expected value. That stronger claim needs a target and assumptions:
- Target: all eligible trades under a fixed rule, a particular market regime, or future trades? These are different questions.
- Selection: were all eligible trades recorded, including losses and failed executions? Keeping only attractive trades introduces selection bias.
- Dependence and stability: do trades overlap or respond to the same event? Has the execution process or market environment changed? Five records need not provide five independent pieces of information.
- Uncertainty: how variable would the estimate be under repeated sampling from the assumed process? An estimate should be accompanied by an uncertainty assessment appropriate to that process.
A confidence interval addresses uncertainty about a target under stated sampling assumptions. It is different from the range of the observed trades, and does not by itself describe where the next trade will fall. With only five observations and a prominent large gain, an automatic normal approximation deserves particular scrutiny. More decimal places in the mean cannot supply missing evidence.
Statistics and probability work in complementary directions: probability studies what observations a specified model could generate; inference asks what models or features are supported by the observations. The model assumptions make that bridge possible. They should remain visible when the conclusion becomes a trading decision.
A useful route onward
For a first calculation-based introduction, Basic Statistics and Regression develops sample summaries, standard errors and fitted relationships. Its public page is a preview; the full Mathematics Primer lesson is available with a free signed-in account.
When applying these ideas to market data, Financial Return Characteristics examines heavy tails, return definitions and volatility clustering, including why dependence in squared returns is not the same as correlation in return levels. The full lesson requires membership; a public preview is available.
Sources
- Larry Wasserman, All of Statistics: A Concise Course in Statistical Inference, Springer, Chapter 6, especially §§6.1–6.2: inference, statistical models and features of a distribution.
- NIST/SEMATECH e-Handbook of Statistical Methods, §1.3.5.1, Measures of Location: arithmetic mean, median and sensitivity to extreme observations. The trade dataset and figure are original synthetic examples.