If a random variable takes values with probabilities , its expected value is
The result keeps the units of : expected dollars for a dollar profit, expected orders for a count, or an expected return for a return. Percentages and the idea of assigning probabilities are enough to follow the example.
A strategy wins often and still has negative expectation
Leah is reviewing a fictional one-period trading opportunity. Her scenario model assigns these probabilities to profit or loss on a fixed position, before a known USD 20 trading cost:
| Scenario | Probability | Profit or loss before cost | Contribution to expectation |
|---|---|---|---|
| Ordinary gain | 70% | +400 USD | +280 USD |
| Moderate loss | 20% | −300 USD | −60 USD |
| Large adverse move | 10% | −2,500 USD | −250 USD |
These are stipulated model probabilities, not observed market frequencies. The scenario list is assumed exhaustive and mutually exclusive. The position's gains and losses are already included; the USD 20 cost has not yet been deducted.
The model gives
The strategy wins in 70% of the modeled cases. Nevertheless, the relatively infrequent large loss makes its expected profit negative. Counting wins without counting their sizes would miss that result.
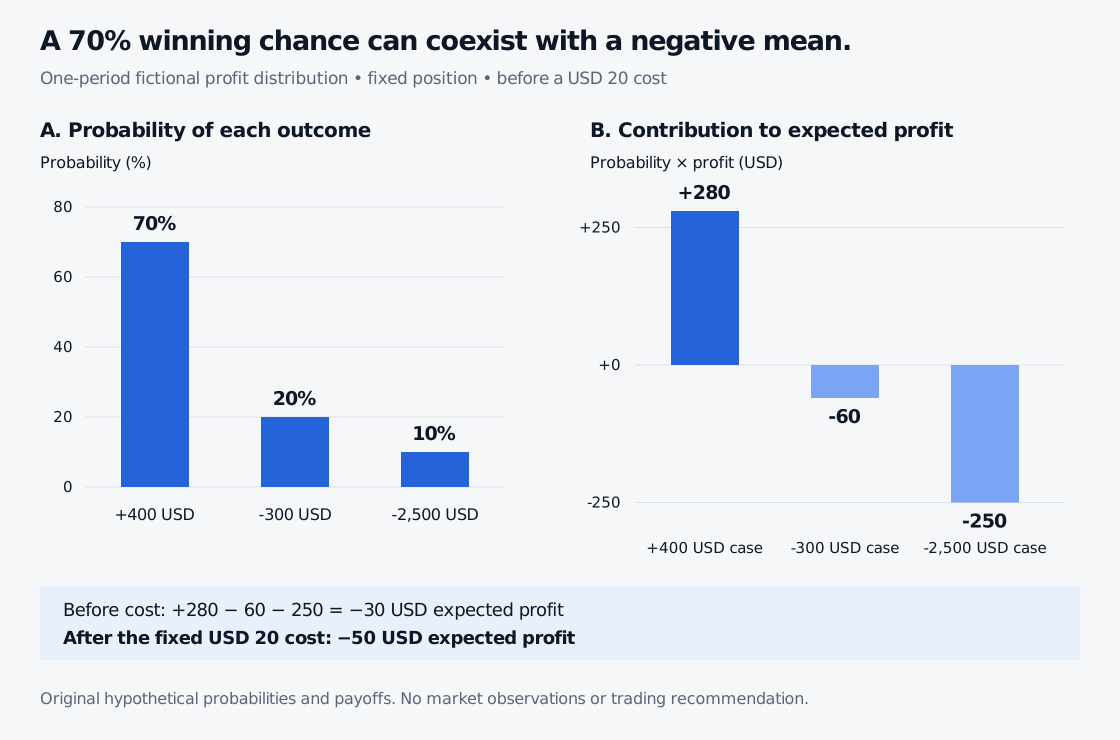
Subtract the deterministic cost once:
The three net outcomes are now +380, −320 and −2,520 USD. None equals −50 USD. An expectation need not be a value that one trade can actually produce.
Where did the probabilities come from?
The weighted sum is easy once the distribution is specified. Establishing that distribution is usually the harder research problem.
If the 70%, 20% and 10% numbers came from historical trades, Leah would need to inspect sample size, costs, market conditions and selection bias. An outcome absent from a small sample does not necessarily have zero probability. Repeatedly selecting the best-looking backtest can also make an estimated mean overoptimistic.
Under suitable conditions, a law of large numbers connects repeated averages to the expectation. It does not ensure that a finite sequence is profitable, that market conditions stay fixed, or that a desk can survive until an average becomes representative.
Linearity lets you add averages without assuming independence
For random quantities with finite expectations and fixed numbers and ,
No independence assumption is needed for this identity. Dependence matters when calculating the distribution or risk of the sum; it does not prevent adding its expectations. Leah's known cost is the same principle applied to a constant.
For another desk task, let equal 1 if order is rejected and 0 otherwise. If each of 100 orders has marginal rejection probability 2%, then
The expected count is two even if rejections cluster during a system outage. Clustering changes risk and the probability of seeing no rejections; those require more information about dependence. Two expected rejections does not mean exactly two will occur.
An expectation always belongs to a model
For a continuous random variable with density , the corresponding weighted average is
References
- Bertsekas and Tsitsiklis, Introduction to Probability, 2nd ed., Chapter 2 §2.4: discrete expectation, finite-mean conditions and linearity. Local grounding text; all trading numbers and illustrations here are original.
- Marco Taboga, StatLect: Expected value and Properties of expected value.
- OpenStax, Introductory Statistics 2e, §4.2: Mean or Expected Value and Standard Deviation, for a further introductory treatment.