The model specifies what can happen and with what probabilities. Monte Carlo supplies a way to calculate with that model. An expected value, for example, can be approximated by the average of simulated outcomes.
To follow the pricing example, it helps to know what an average, a standard deviation and a European call option mean. The numerical example uses hypothetical inputs, with a known analytical answer so we can inspect the simulation error directly.
A price that comes with an error bar
Leah is checking a pricing engine. A one-year call has a spot price of 100 USD and a strike of 105 USD. The model assumes 25% annual volatility, a continuously compounded risk-free rate of 4% and a continuous dividend yield of 1%.
Instead of producing one future stock forecast, the engine generates many possible terminal prices. For each one it calculates the call's payoff, , and discounts that payoff to today. The average discounted payoff estimates the option's model value.
There are two choices to make before drawing anything:
| Calculation | Probability law used |
|---|---|
| Value this European call in the specified pricing model | The risk-neutral measure, |
| Forecast a future profit-and-loss distribution | Typically a physical probability measure, , intended to represent real-world outcomes |
Risk-neutral probabilities serve the valuation calculation. They are not the desk's forecast of how often a stock will rise. For this dividend-paying stock model, the risk-neutral price drift is . Substituting a bullish historical return estimate would change the expectation being computed.
One random draw becomes one discounted payoff
Under risk-neutral geometric Brownian motion, terminal stock prices can be sampled directly:
The are independent draws from the standard normal distribution. The inputs are , , , , and year. For each simulated terminal price, calculate
where . The target is .
Here is the complete calculation in standard-library Python, using a fixed random seed:
from math import exp, sqrt
from random import Random
from statistics import mean, stdev

rng = Random(20261024)
s0, strike = 100.0, 105.0
r, q, sigma, maturity = 0.04, 0.01, 0.25, 1.0
n = 100_000
payoffs = []

for _ in range(n):
    z = rng.gauss(0.0, 1.0)
    terminal = s0 * exp(
        (r - q - 0.5 * sigma**2) * maturity
        + sigma * sqrt(maturity) * z
    )
    payoffs.append(exp(-r * maturity) * max(terminal - strike, 0.0))

estimate = mean(payoffs)
se = stdev(payoffs) / sqrt(n)
print(f"price={estimate:.6f}, SE={se:.6f}")
print(f"interval=[{estimate - 1.96 * se:.6f}, {estimate + 1.96 * se:.6f}]")
# price=8.889168, SE=0.050588
# interval=[8.790015, 8.988321]
The seed makes this pseudorandom experiment reproducible with this generator. It does not certify the model's assumptions or make the estimate equal to the target.
What does the reported standard error measure?
For independent, identically distributed outputs with finite variance, the estimated Monte Carlo standard error is
The law of large numbers explains convergence of the average to its model expectation. The central limit theorem supports the large-sample, approximate 95% confidence interval
This is an interval procedure for simulation uncertainty around a fixed model value. If we repeated independent runs at a fixed sample size, approximately 95% of the resulting intervals would cover that value when the normal approximation is adequate. It is not a 95% probability forecast for the stock, and the formula is not automatically reliable for sparse rare-event samples, dependent draws or infinite-variance outputs.
This particular 95% interval misses the known answer
| Independent scenarios | Estimated price, USD | Estimated standard error, USD |
|---|---|---|
| 1,000 | 8.246376 | 0.472524 |
| 4,000 | 8.822456 | 0.247982 |
| 10,000 | 8.750931 | 0.158317 |
| 100,000 | 8.889168 | 0.050588 |
The 10,000-scenario estimate is farther from the benchmark than the 4,000-scenario estimate, even though its standard error is lower. Standard error describes the scale of repeated-run variation; it is not the realised absolute error of a particular run.
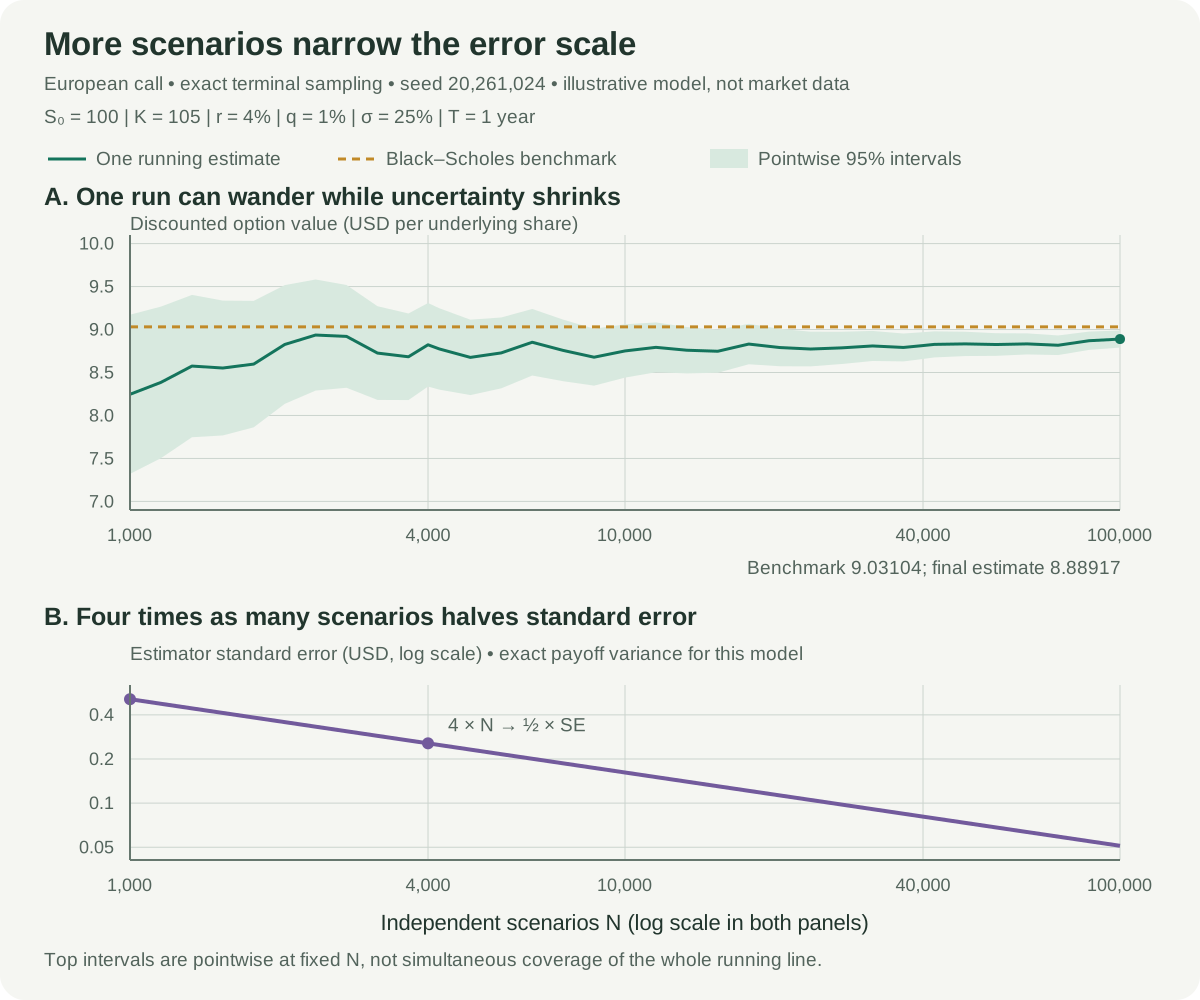
At a fixed payoff variance, quadrupling halves standard error; reducing it tenfold requires 100 times as many samples. The same random stream supplies the successive estimates above, so those checkpoints are correlated. Repeatedly inspecting the intervals and stopping when they look favourable does not preserve the fixed-sample coverage claim.
More scenarios cannot repair every error
This example samples the exact terminal distribution of its chosen model, so there is no time-discretisation bias. A simulator that approximates an SDE on a coarse grid can instead converge very precisely to the wrong discretised expectation. More paths reduce sampling noise; finer or better time-stepping addresses that numerical bias. A continuously monitored barrier can also be missed between simulated dates.
Model risk remains even with exact sampling. Constant-volatility GBM may be a poor description of a real instrument, and estimated parameters carry their own uncertainty. Neither problem is covered by the simple Monte Carlo error bar.
A European call is a useful test because its analytical price is available. In practice, closed-form valuation is cheaper for this example. Simulation earns its place when payoff structure, path dependence or many risk factors make other approaches difficult. Its square-root sampling rate has no explicit dimension exponent, but the cost per scenario and the payoff variance can both grow with the problem.
Calculate the benchmark and build the underlying skills
Sources
- Paul Glasserman (2004), Monte Carlo Methods in Financial Engineering, Chapter 1, especially §§1.1–1.2: sampling averages, error, efficiency and risk-neutral pricing.
- Mike Giles, Monte Carlo Methods, Lecture 1: GBM sampling, Monte Carlo error and variance reduction.
- Mike Giles, Monte Carlo Methods, Lecture 2: Greeks, path simulation and discretisation effects.