Define a statistical population by its units, time window and eligibility, distinguish it from the frame and sample, and separate a finite census from a model of future outcomes.
Population
A population is the complete collection of units about which a statistical question is asked. It might be all eligible orders submitted by one desk during one trading session, rather than every order in a database or every possible trade. A sample is the subset observed for the analysis.
In model-based statistics, the word also refers to a probability distribution or process generating possible observations. Distinguishing that model from a finite collection matters: describing yesterday's orders and estimating tomorrow's expected trading result are different tasks.
Define the question before counting rows
A usable population definition specifies the unit, the time window and the eligibility rule. For example: each parent order submitted by Desk A between 09:30 and 16:00 exchange-local time on a named session date, including rejected, cancelled and unfilled orders. Each parent counts once; its child fills are not additional parents.
Together with the outcome definition and weighting, these choices determine the estimand: the quantity the analysis is trying to learn. Mean dollars per submitted order, mean dollars per filled order and a notional-weighted execution cost answer different questions. A P&L measure also needs a valuation horizon, currency and treatment of fees and residual positions.
Keep three collections separate:
Collection
What it means in an order study
Target population
Every order satisfying the research definition.
Accessible frame
The records or identifiers through which eligible orders can be found and selected.
Observed sample
The units whose usable outcomes actually enter the calculation.
The frame can omit eligible orders, duplicate them or contain ineligible records. Selection and missing outcomes can narrow the observed set further. These are reasons to reconcile identifiers and eligibility before computing statistics. Random selection within a frame does not make excluded target units observable. Statistics Canada's sampling guide explains these distinctions in survey terms; they apply equally well to a trading-data extract.
Eight orders, two different means
Consider a hypothetical completed session with exactly eight eligible orders. For each, suppose the correctly measured net P&L at a fixed session-end valuation is known, including fees and any residual position. Label the orders A through H and assign their outcomes, in USD, as
(x1,…,x8)=(−4,−2,0,1,2,3,4,12).
For this finite target, the mean is a parameter: a fixed characteristic of these eight outcomes. It is known here because the example gives every value:
The divisor is eight because we are describing all eight target values. Some finite-population sampling texts also define a variance with divisor N−1 for estimation formulas; state the convention rather than silently switching it.
Now suppose an analyst observes only A, C, E and H, with outcomes (−4,0,2,12). The sample mean is
xˉ=4−4+0+2+12=2.5 USD.
This is a statistic, calculated from the selected observations. It exceeds the target mean by USD 0.50. A different selection could give a different result; the finite target mean stays USD 2. The discrepancy alone does not establish systematic selection bias, and no random sampling design has been assumed for this selection.
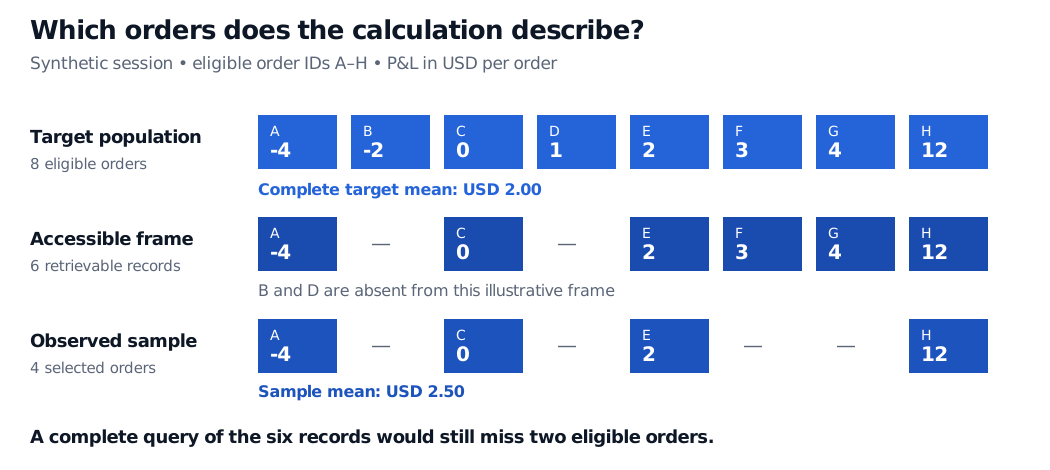
Synthetic order P&Ls in USD: target A–H has values -4, -2, 0, 1, 2, 3, 4 and 12 with mean USD 2.00. The accessible frame omits B and D; observed orders A, C, E and H have mean USD 2.50.
Original synthetic example. Each filled cell is an included order with its USD outcome; dashes indicate absence from that row. The frame has six records, while the target has eight orders.
A census of the database is not automatically a census of the target
In the illustration, reading every one of the six accessible records still misses B and D. The query is exhaustive for that frame, but not for the target. In real research, a database of surviving funds can similarly exclude funds that closed: survivorship bias can remain even when every available row is used.
A genuine census with correct measurement removes sampling uncertainty about that finite target's summaries. It does not remove erroneous timestamps, duplicated orders, wrong currency conversions or unrecorded fees. Coverage and measurement errors can affect censuses as well as samples; Statistics Canada's coverage guidelines explain why the frame must be checked against the intended population.
From a finite session to a trading process
To ask about future sessions, a researcher may introduce a superpopulation model: a probability law under which the observed orders are realisations of a broader process. A model mean such as E[X] concerns that law. It need not equal the realised mean μN of yesterday's eight orders, even if those eight were observed perfectly.
The step requires assumptions about how historical observations relate to the intended future orders. Independence, stable distributions and representative selection do not follow from having a large database. Regime changes or changes in execution policy can break the connection. A complete historical census therefore cannot, by itself, establish a future expected profit.
For the next step from population parameters to sample summaries, Basic Statistics and Regression develops sample mean, variance and standard error. The public page is a preview; the full lesson is available with a free signed-in account.
Sources
John A. Rice, Mathematical Statistics and Data Analysis, 3rd edition, Chapter 7, especially §7.1 (survey sampling) and §7.2 (finite-population parameters), and §8.1 (fitting probability laws to data).