A statistic is a data-based rule with no unknown parameters. Separate the random quantity from its observed value, and see how statistics become estimators or test statistics.
Statistic
A statistic is a quantity calculated from sample data by a specified rule that uses no unknown parameters. A sample average, a sample variance and the largest observed return are all statistics. Known constants, including sample size and a benchmark fixed in advance, are allowed.
A quant sees a finite history of returns, not the entire process generating them. Statistics compress that history into quantities that can describe the sample, estimate model features or help test a claim. Calculating a statistic and justifying what it tells us are separate tasks.
The rule, the random quantity and the number
Write a sample before observation as X1,…,Xn. A statistic is
T=T(X1,…,Xn).
The rule T(⋅) is fixed. Because its inputs are random variables, its output is random before the sample is observed. After seeing values x1,…,xn, we calculate the observed valuet=T(x1,…,xn). Everyday speech often calls this number “the statistic” too; distinguishing the two meanings matters when discussing uncertainty.
The sampling distribution describes how the statistic would vary across repeated samples under an assumed data-generating model. That distribution can depend on unknown parameters even though the calculation rule cannot. “No unknown parameters in the rule” does not mean “a distribution independent of parameters.”
Four returns, three summaries
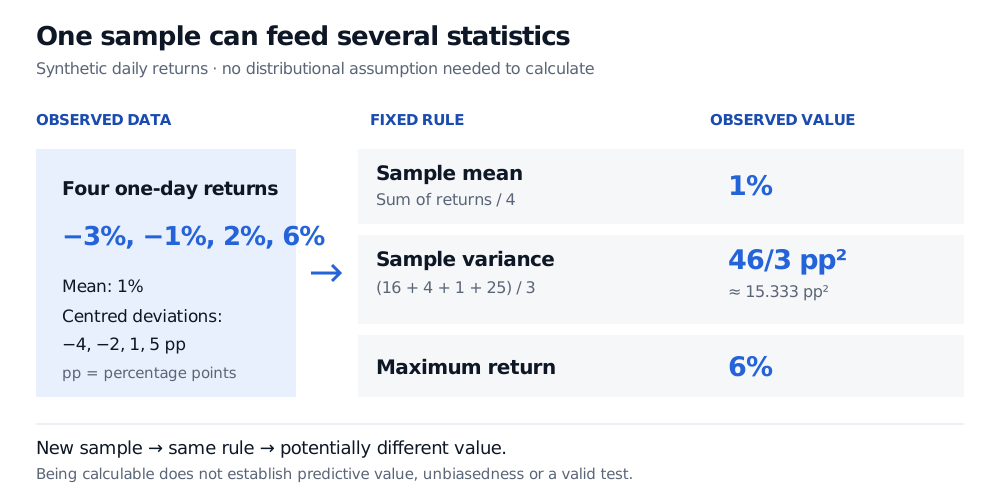
Suppose a researcher records these synthetic one-day simple returns, expressed in percentage-point coordinates:
x=(−3,−1,2,6).
Thus the first return is −3%, not −300%. With n=4, the observed sample mean is
in squared percentage points. The maximum is 6%, another statistic calculated from the same sample. None requires the population mean or variance to be known.
Four synthetic one-day returns of minus 3%, minus 1%, 2% and 6% feed fixed rules yielding mean 1%, sample variance 46/3 squared percentage points and maximum 6%.
Original synthetic example. The same data support several summaries with different units and purposes; a different sample can change their observed values.
No independence or normality assumption is needed merely to calculate these summaries. To interpret S2 as an unbiased estimator of population variance, however, the usual justification assumes identically distributed independent observations with finite variance and n≥2. A four-day descriptive example alone establishes no reliable trading edge.
The unknown-parameter trap
The sample-centred formula
S2=n−11i=1∑n(Xi−Xˉ)2
is a statistic: Xˉ is itself calculated from the data. By contrast,
n1i=1∑n(Xi−μ)2
is not a statistic when μ denotes the unknown population mean. You cannot evaluate it from the sample alone. Replacing μ with the sample mean produces a statistic, although using divisor n gives a different variance estimator from S2.
A prespecified null value μ0 is different. It is a known number, not the unknown true mean. For example, the discrepancy Xˉ−μ0 is a valid statistic. Its usefulness for a hypothesis test depends on a justified reference distribution and a stated testing procedure.
What role does the statistic play?
An estimator is a statistic used to estimate a target parameter. Using Xˉ to estimate expected daily return gives it that role; the realised 1% is then the estimate. A test statistic is used to assess a specified hypothesis, often after scaling a discrepancy by its estimated uncertainty. A descriptive maximum need serve neither role.
Being a statistic does not guarantee unbiasedness, precision, robustness or forecasting value. Those are further properties to investigate, using assumptions appropriate to the sampling design and financial data.
For calculations and the transition to regression, read Basic Statistics and Regression. For the next step from a statistic to an estimator, Estimation and Maximum Likelihood develops bias, variance and estimation risk. The primer is free in full with a signed-in account; the estimation lesson requires membership. Both offer public previews.
Sources
Casella, G. and Berger, R. L. Statistical Inference, 2nd ed., §5.2, Definitions 5.2.1–5.2.3: statistics, sampling distributions, sample mean and sample variance.