An estimator is a rule that turns sample data into an approximation of an unknown parameter. A rule producing one value is a point estimator. Applying it to the data actually observed produces a point estimate. In finance, the rule might estimate expected return, return variance or a default probability; the number is useful only once its target and assumptions are clear.
A rule before the numbers arrive
Write a point estimator as
where are random observations and is the target. The calculation uses observable data and known quantities, rather than requiring the unknown parameter as an input. After observing values , the realised estimate is .
Before observation, the estimator is random because its inputs are random. Afterwards, its computed value is known, while the target generally remains unknown. The estimator has a sampling distribution: the distribution of outputs it would produce across repeated samples under the assumed data-generating process. One observed estimate cannot reveal that entire distribution.
Same returns, different questions
Suppose an analyst observes a strategy's simple returns over four equal-length periods: −1%, 0%, 1% and 4%. These are synthetic observations, with no annualisation or compounding across periods in the following calculations.
If the target is the population mean return , a natural estimator is the [sample mean. Working in percentage points, its realised value is
The estimate is therefore 1% per period. This does not establish that the strategy's population mean is 1%, or that its next return will be 1%.
If the question is instead about the middle of the return distribution, the analyst might estimate its population median. Using the convention that an even sample's median is the midpoint of its two central ordered observations gives
or 0.5% per period. The convention matters: finite-sample quantile definitions can differ.
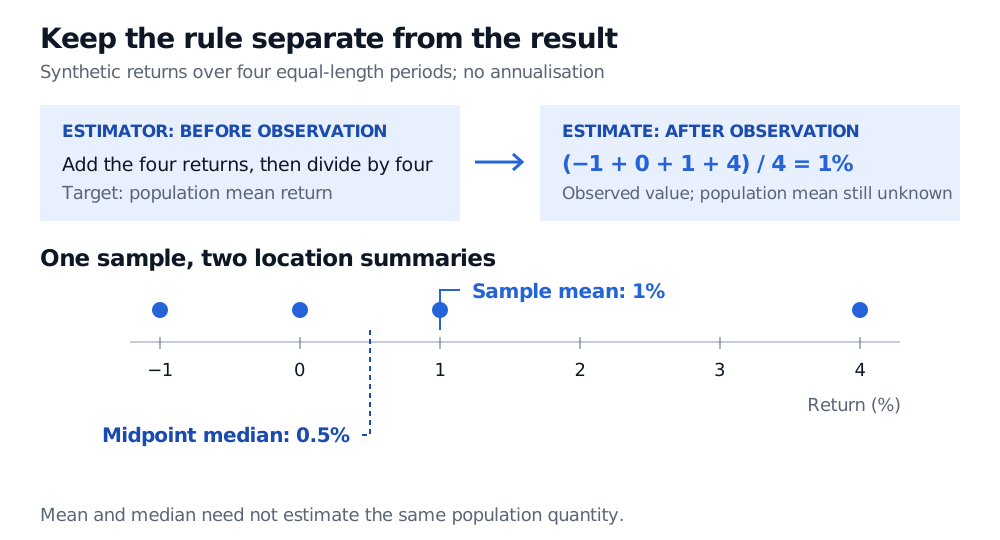
Original synthetic example. Return axis is in percent; both summaries use the same four equal-length periods.
The two answers need not conflict. Mean and median are generally different functionals, meaning different numerical features of the population distribution. Choosing the median because it reacts less to one extreme return changes the target unless a model justifies treating both as estimators of the same quantity. For example, a normal return model has a common population mean and median. Symmetry alone does not ensure the mean exists.
What makes the rule credible?
An estimator's definition does not guarantee that it is accurate, unbiased or consistent. Those properties depend on the rule, the target and the sampling assumptions.
For independent, identically distributed returns with finite mean and finite variance , the sample mean satisfies
Its standard error is therefore . Normal returns are unnecessary for these identities. Independence is unnecessary for unbiasedness if each observation still has mean , but dependence generally changes the variance formula through covariance terms. A changing return regime also challenges the idea that one fixed population mean describes both the historical sample and the future.
Compare candidate estimators against the same target, using a criterion appropriate to the decision. Mean squared error combines squared bias and sampling variance; low bias alone does not guarantee a useful estimate. Report the rule, data window, return horizon and an uncertainty measure whose assumptions fit the data. Extra decimal places in the output do not supply extra evidence.
For derivations and financial examples, Estimation and Maximum Likelihood develops estimator risk and fitted default and return models. Its full lesson requires membership; a public preview is available.
Sources
- Larry Wasserman, All of Statistics: A Concise Course in Statistical Inference, §§6.2–6.3.1 and 7.2: statistical functionals, point estimators, sampling distributions and estimator quality.
- Brian Junker, Carnegie Mellon University, Estimation II: Some Methods of Estimation, 36-310, 6 April 2004, opening review: parameter, statistic, point estimator and point estimate.