A return is not its model's mean
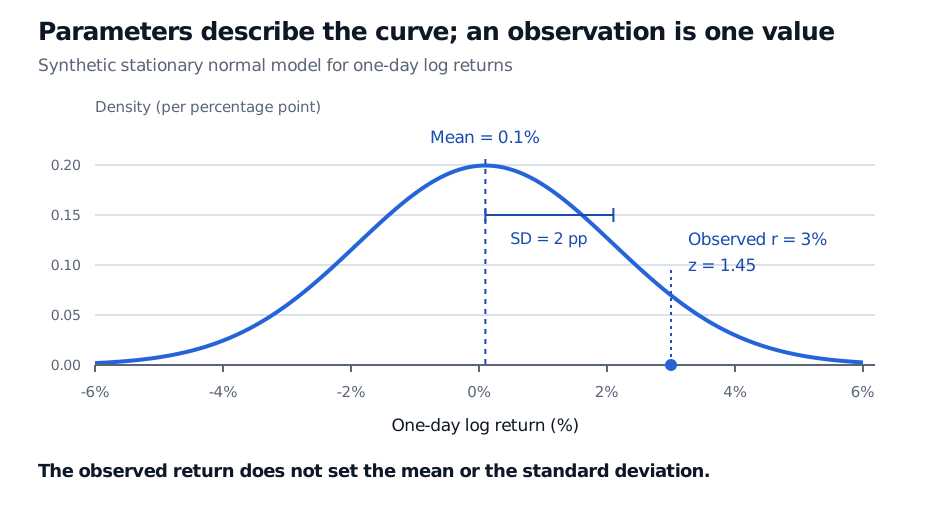
The horizon and units matter. This is a mean of 0.1% and a standard deviation of 2 percentage points for a one-day log return. Variance is in squared decimal-return units; in percentage-point coordinates it is squared percentage points. These are daily distribution inputs, not annualised drift or volatility inputs for a continuous-time model. We require for the non-degenerate normal density used here.
Now the next day produces the observation , a 3% log return. Its standardised distance from the assumed mean is
The return lies 1.45 standard deviations above the model mean. It does not replace with 3%, and it does not reveal the true volatility. The score measures a distance, not the probability of that exact return. Under a continuous normal model, any single exact value has probability zero; probabilities come from intervals.
Unknown parameter, estimator, estimate
In classical estimation, an unknown parameter is treated as fixed within the assumed model. The data vary across hypothetical repeated samples. That creates five different objects:
| Object | In this example | Role |
|---|---|---|
| Parameter | Mean of the model distribution; possibly unknown | |
| Random variable | A daily log return before observation | |
| Observation | The recorded value of that return | |
| Estimator | Rule applied to random data; random before observing the sample | |
| Realised estimate | The numerical output after the data are supplied |
For a separate synthetic historical sample of five log returns, , the sample mean is , or 0.13%. That is one realised estimate of , not proof that . Another sample generally gives another estimate. Five observations are used only to make the arithmetic visible, not to suggest adequate precision for estimating a financial mean.
“Parameter” does not mean permanently constant
Constant parameters are an assumption of the stationary example above. Other models specify time-varying coefficients, conditional means or stochastic volatility. Bayesian inference represents uncertainty about unknown parameters with a prior and posterior distribution. None of these uses turns a model parameter into an observed return.
In software, “parameter” can also mean a function argument, and “hyperparameter” often means a setting governing how a model is fitted. An argument may carry a model parameter, an observed price or a training setting. Check the mathematical role and units rather than assuming every input is the same kind of object.
Sources
- Dimitri P. Bertsekas and John N. Tsitsiklis, Introduction to Probability, 2nd edition, Athena Scientific, 2008, §9.1, “Classical Parameter Estimation”; Chapter 8 provides the Bayesian contrast.
- NIST/SEMATECH e-Handbook of Statistical Methods, §1.3.6.6.1: Normal Distribution, for normal parameters and their estimation.
- NIST/SEMATECH e-Handbook of Statistical Methods, §1.3.6.4: Location and Scale Parameters, for how location and scale select a distribution. The return scenarios and diagram here are original.