A sample is the collection of units selected for a study, or the measurements recorded from those units. A researcher might analyse a sample of trades, fund returns or option quotes to learn about a defined population. The word alone says nothing about how the records were selected: a sample can be random, deliberately chosen or simply convenient to obtain. Official sampling guidance distinguishes these designs explicitly. Australian Bureau of Statistics
For financial research, the important question is “a sample of what, selected how?” Four daily returns on one instrument and four returns on different instruments on the same date are different collections, even if the four numbers match. State the instrument universe, dates, return horizon, units and inclusion rules before interpreting a summary.
Four observations, one summary
Suppose a researcher records these hypothetical one-period simple returns for one strategy, on four selected dates. Express returns in percentage points: a value of −2 means a −2% return, or −0.02 in decimal form.
These four values are the realised sample. Their sample mean is
The deviations from that mean are −3, −1, 0 and 4 percentage points. Using the usual definition, the sample variance is
The mean and variance compress the observations; neither is the sample itself. Nor does an average return of 1% mean every observed return was positive. This arithmetic mean also differs from a compounded return over consecutive periods; the four selected dates need not even form an unbroken investment path.
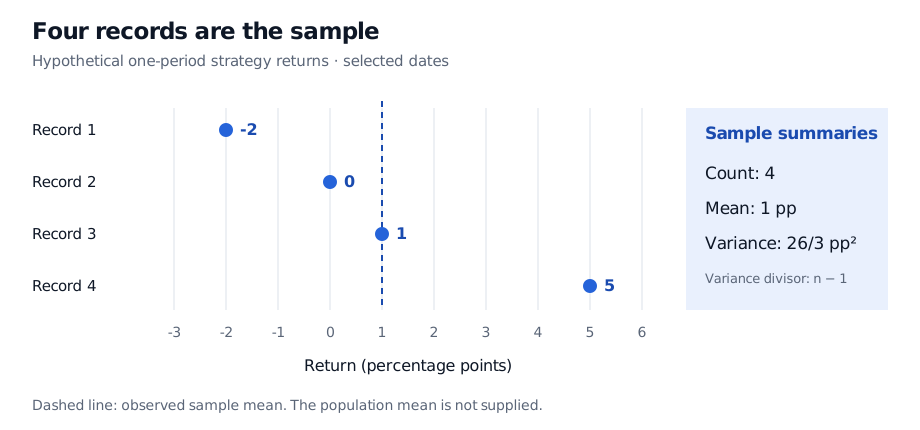
Original synthetic data. Each filled point is one observed return, with record identity retained. The dashed line is their arithmetic mean, not a known population mean.
Before observation, the numbers are uncertain
When a probability model describes collection, uppercase denotes the random measurements before their outcomes are known; lowercase denotes the values actually obtained. The vector and its realised value are related, but are not interchangeable.
A statistic is a function of the sample that does not require unknown parameters. Before observation, is random; after observation, its realised value here is . A population mean , by contrast, describes the target population or specified data-generating distribution. Under a fixed-population frequentist model it is fixed, although it may be unknown. This sample does not establish that .
Three distributions also need separating:
| Object | What it describes |
|---|---|
| Population distribution | Values across the target population, or outcomes under the specified population model |
| Empirical distribution | The observed sample, assigning weight to each of these four records |
| Sampling distribution | How a statistic would vary across repeated samples under a stated sampling mechanism or model |
Here the empirical distribution puts 25% mass at each of −2, 0, 1 and 5. That is a description of the four records, not a claim that the next return has those four outcomes with those probabilities.
A row count is not a guarantee
A random sample, in the common textbook model, consists of independent, identically distributed measurements. That is an additional assumption, not part of the meaning of “sample.” Survey designs such as simple random sampling without replacement also use random selection, while their draws are dependent.
A convenience sample of surviving funds remains a sample, but its mean may answer a different question from the mean across all funds, including closures. Sampling bias concerns that selection problem. A larger collection from the same restricted source does not automatically repair it; Statistics Canada explains why non-probability samples require assumptions to support population conclusions. Statistics Canada
Likewise, sample size counts records, not independent pieces of information. Overlapping return windows can share price changes; duplicating a row creates no new observation. Even a long, clean historical sample does not guarantee that future trading conditions follow the same population model. The inferential step needs a defensible relationship between the selected records and the question being asked.
For a worked introduction to summaries and their assumptions, Basic Statistics and Regression develops sample means, variances and standard errors. The public page is a preview; the complete lesson is available with a free signed-in account.
Sources
- John A. Rice, Mathematical Statistics and Data Analysis, 3rd edition, Chapter 7, §§7.1–7.3: sampling designs, population parameters and random variation in sample summaries.
- George Casella and Roger L. Berger, Statistical Inference, 2nd edition, §§5.1–5.2, especially Definitions 5.1.1 and 5.2.1: the IID random-sample model, statistics and sampling distributions.
- Australian Bureau of Statistics, “Census and sample”: partial enumeration and random versus non-random selection.
- Statistics Canada, “3.2.3 Non-probability sampling”: convenience and other non-probability designs, with their inferential limitations.