Distinguish an iid random sample from finite-population sampling without replacement, and see why random selection need not produce a representative realised sample.
Random sample
A random sample, in the usual mathematical-statistics sense, is a collection X1,…,Xn of mutually independent random variables with the same probability distribution. This is the iid model: independent and identically distributed. It lets an analyst describe how an estimate would change if the data collection were repeated.
In survey sampling, the phrase also has a broader meaning: observations selected by a specified random mechanism. A simple random sample without replacement from a finite population is a legitimate probability sample, but its draws are generally dependent. Before using a sampling formula, identify which meaning and which design apply.
There are two separate requirements. Identically distributed means every observation has the same distribution; it does not mean the realised values are equal. Independent means learning the other observations does not change an observation's distribution. Equal individual distributions alone do not establish independence.
The capital letters describe random variables before observation; x1,…,xn denote the realised data. The definition requires neither normality nor a particular sample size. Finite moments are extra assumptions needed for the mean and variance formulas below.
For an iid sample with finite population mean μ and variance σ2, the sample mean satisfies
Xˉ=n1i=1∑nXi,E[Xˉ]=μ,Var(Xˉ)=nσ2.
The first equality about expectation comes from linearity. The variance result uses independence to eliminate cross-covariances. Its square root, σ/n, is the standard error of the mean when the population standard deviation is known. It measures repeated-sample uncertainty, not the dispersion of individual trades.
A two-trade benchmark with an imperfect realised sample
Suppose a researcher is testing a sampler against a deliberately simple synthetic P&L model. Each fixed-size trade produces USD 0 or USD 10, each with probability 1/2. The target is the expected P&L per trade under this specified model, USD 5. The population variance is 25USD2.
Generate two observations independently from that distribution. Equivalently, draw twice from two labelled tickets carrying 0 and 10, replacing the ticket and randomising independently each time. There are four equally likely ordered outcomes:
Ordered P&Ls, USD
Probability
Sample mean, USD per trade
(0,0)
1/4
0
(0,10)
1/4
5
(10,0)
1/4
5
(10,10)
1/4
10
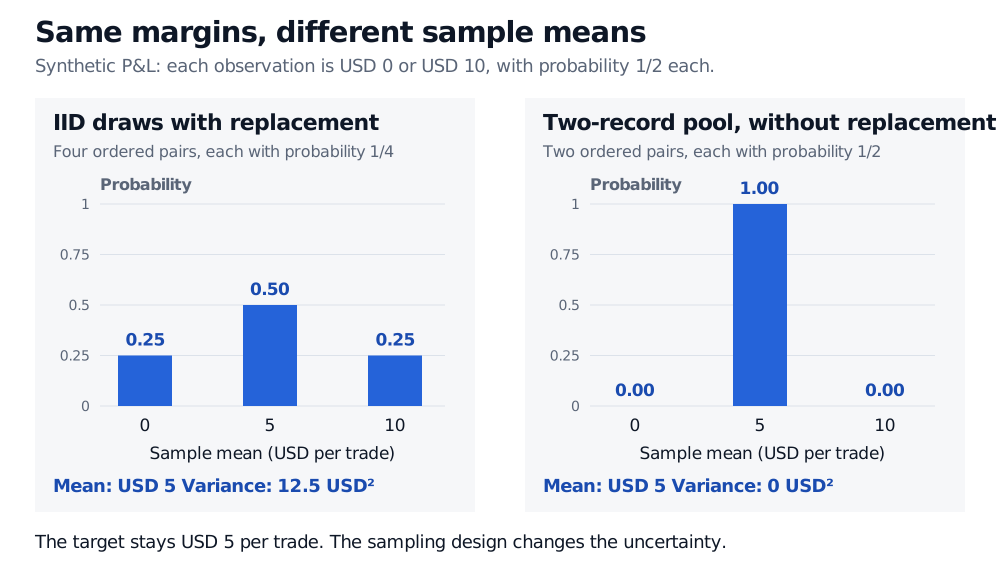
The sampling distribution of the mean therefore has probabilities 1/4,1/2,1/4 at 0, 5 and 10. Directly,
This matches σ2/n=25/2. Yet half of all two-observation samples have a mean different from the target. Random selection does not promise a perfectly representative realised sample. Unbiasedness is a statement about the average estimate over repetitions, not a guarantee about one dataset.
Two synthetic P&L observations each have marginal probabilities one half at USD 0 and USD 10. IID sampling with replacement gives sample means USD 0, USD 5 and USD 10 with probabilities 0.25, 0.50 and 0.25, and variance 12.5 USD squared. Without replacement from two fixed records, the mean is always USD 5 and its variance is zero.
Original exact enumeration, not simulated market data. Both designs have individual mean USD 5 and variance 25 USD squared; their sample-mean distributions differ.
Remove replacement, and the question changes
Now treat those two tickets as a fixed finite population of two trade records, one with P&L USD 0 and one with P&L USD 10. The target is this finite population's average P&L, USD 5 per record. Select both records without replacement, randomising the order.
Only (0,10) and (10,0) can occur, each with probability 1/2. Each draw still has the same marginal distribution as before. But after observing the first value, the second is certain: if X1=0, then X2=10. These draws are dependent. Their mean is always USD 5, so its sampling variance is zero.
For a finite population of size N>1, a simple random sample without replacement gives every subset of n distinct units the same probability. Writing the fixed values as y1,…,yN, define
μN=N1j=1∑Nyj,σN2=N1j=1∑N(yj−μN)2.
Under that design,
E[Xˉ]=μN,Var(Xˉ)=nσN2N−1N−n.
The variance convention here uses divisor N. The last factor is the finite-population adjustment to the iid variance. When n=N, the entire finite population has been observed and its mean has no sampling uncertainty. When n=1, the variance is σN2. If n is small relative to N, the adjustment is close to one, which can justify an approximation for this variance; it does not make the draws exactly independent.
A census of historical trade records removes sampling error about those records. It does not remove uncertainty about future trades or prove that the historical model will persist.
What a return dataset needs before calling it iid
A file of consecutive daily returns is a sample of observations, but calendar order does not establish the iid model. Dependence, changing volatility or a changing return distribution can invalidate its assumptions. Shuffling the rows changes their presentation; it does not establish the iid model or justify removing covariance terms.
With finite second moments, the general identity is
Var(Xˉ)=n21(i=1∑nVar(Xi)+2i<j∑Cov(Xi,Xj)).
The covariance terms explain why plugging a daily standard deviation into σ/n can misstate uncertainty. Even zero pairwise covariances do not, by themselves, prove independence.
Finally, specify the population before choosing observations. Randomly sampling from a list containing only surviving funds cannot recover funds missing from that list. Randomisation operates on the sampling frame supplied to it; it does not automatically repair sampling bias from an incomplete frame or selective measurement.
For a first pass at sample summaries and their assumptions, see Basic Statistics and Regression (public preview; full lesson free with a signed-in account). Populations, Samples, and Sampling Distributions develops the iid mean, variance and normal-family results in detail (public preview; full lesson requires membership).
Sources
Casella, G. and Berger, R. L., Statistical Inference, 2nd ed., §5.1, especially Definition 5.1.1 and the discussion of finite-population sampling; §5.2 for sample-mean properties.
Rice, J. A., Mathematical Statistics and Data Analysis, 3rd ed., §§7.2–7.3: finite populations, simple random sampling and the sample mean's expectation and variance.