How data support estimation, testing and prediction: an exact twenty-order fill study separates sampling uncertainty, p-values and future outcomes.
Statistical inference
Statistical inference uses observed data, together with a sampling model, to learn about an unknown population, data-generating process or future outcome. An execution desk that records ten fills in twenty orders knows its historical fill fraction. Inferring a fill probability for comparable orders requires a further argument about how those observations were generated and what uncertainty remains.
A sample describes what was observed. An inference reaches beyond those records. The distinction matters even when the arithmetic is only a fraction.
Three questions behind the same records
Task
Question for an execution desk
What the answer needs
Estimation
What is the fill probability?
A point estimate and a description of estimation uncertainty
Testing
Is there evidence that the fill probability exceeds a specified benchmark?
A predeclared hypothesis, decision rule and error calibration
Prediction
Will a new comparable order fill?
A forecast for a new outcome, allowing for outcome randomness and uncertainty about the model
These tasks overlap, but their outputs answer different questions. A confidence interval estimates an unknown quantity through a procedure with stated repeated-sampling coverage. It is not an interval guaranteed to contain the next outcome. Bayesian inference instead combines a prior with a likelihood to form a posterior; its probability statements depend on that additional specification.
Twenty orders, one explicit model
Consider a hypothetical study fixed in advance at twenty trials. Each trial submits a comparable order under a stated execution policy and records a fill within the same fixed horizon. Assume the fill indicators are independent, share a constant probability p, and all qualifying trials are recorded:
This estimates a probability; it does not establish that half of every future batch will fill. Under the assumed model, the estimator has variance p(1−p)/20. Substituting the estimate gives an estimated standard error of
SE(p^)=200.50(1−0.50)≈0.1118,
about 11.2 percentage points. This measures estimated sampling variability of the fraction, not uncertainty in the binary value of the next order. It is not, by itself, a confidence interval.
Now ask a separate question: does the evidence contradict a benchmark of at most 30% fills? Before seeing the outcomes, specify
H0:p≤0.30versusH1:p>0.30,
and reject when K≥10. The hypothesis test is calibrated from the count's exact sampling distribution:
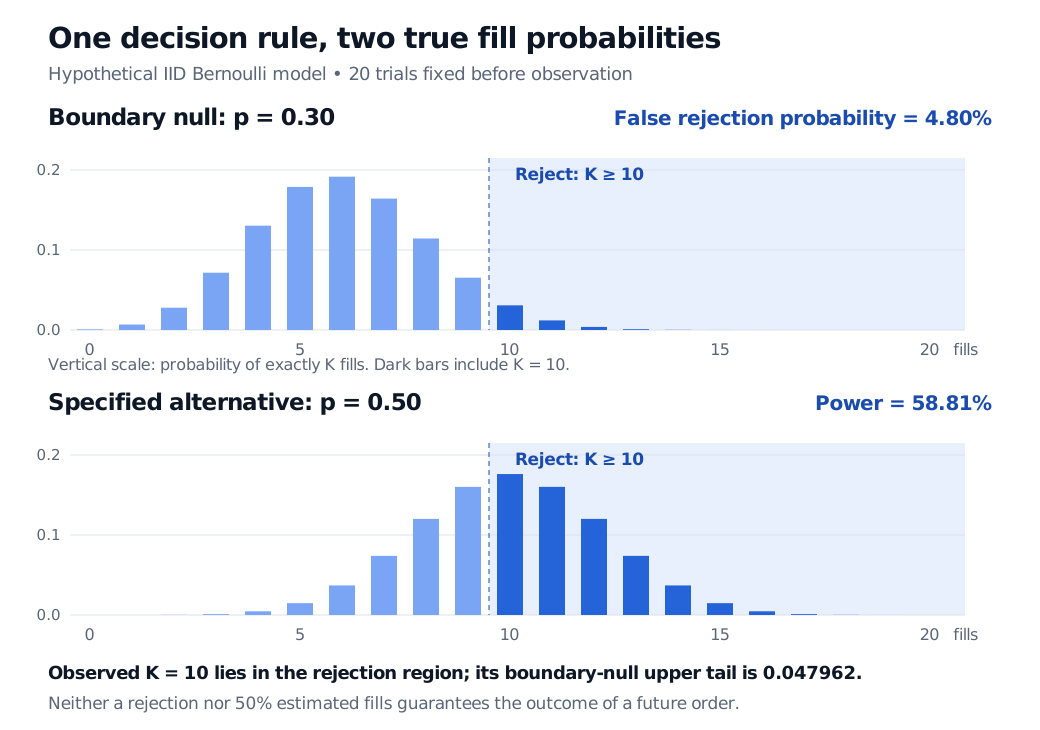
The maximum occurs at the null boundary because increasing p increases the probability of a count at least ten. Thus this rule has a false-rejection probability no greater than 5% throughout the stated null, under the model. Its actual maximum is about 4.80%; discreteness prevents this particular rule from attaining exactly 5%.
The observed count is ten, so the rule rejects. Its one-sided p-value is the same upper-tail probability, about 0.047962. This is evidence against the specified null under the assumptions. It is not a 4.80% probability that the null is true, nor a probability that the execution policy is profitable.
Exact binomial masses for 20 hypothetical independent fill trials. Reject at ten or more fills. The dark included masses total 4.80% at the boundary null p = 0.30 and 58.81% at the alternative p = 0.50.
The same fixed rejection rule behaves differently under different true probabilities. At a true fill probability of 50%, its statistical power is only 58.81%; it still frequently fails to reject. These are model probabilities, not observed frequencies from a simulation.
For prediction, a plug-in forecast would assign the next comparable order an estimated fill probability of 50%. Even knowing the true probability would leave the next binary outcome uncertain. Estimating it adds uncertainty; a predictive analysis should account for that estimation step rather than treating p^ as known truth.
What the inference leaves conditional
The study targets the orders, policy, market conditions and horizon it actually represents. Orders exposed to the same liquidity shock may be dependent. Changing order sizes, queue positions or market conditions may change their fill probabilities. Then the binomial calculation can be arithmetically exact while its sampling model is inappropriate.
Likewise, an observational comparison does not by itself show that a policy caused better fills. A high fill rate can coexist with poor prices or adverse selection. Statistical evidence about fills answers a narrower question than economic value.
A useful inference therefore reports the target, data collection, assumptions, estimate and uncertainty together. Additional data can reduce sampling error under a valid design; they do not automatically repair selection bias or a changing target population.
For a worked treatment of intervals and tests for return means, see Confidence Intervals and Hypothesis Testing (membership for the full lesson; public preview). It develops the distinction between an estimated effect, its uncertainty and evidence against a null using a different sampling model.
Sources
Larry Wasserman, All of Statistics: A Concise Course in Statistical Inference (Springer, 2004), Chapter 6, especially §§6.1–6.3, for models, estimation, confidence sets and testing; §6.2, Example 6.6, for prediction. CMU-hosted text.