Statistical power is a test’s probability of rejecting at a specified alternative. Compute both normal-test tails, compare study designs, and separate planning power from observed evidence.
Statistical power
Statistical power is the probability that a specified hypothesis test rejects its null hypothesis when a particular alternative is true. It measures a procedure's ability to detect an effect under a stated data-generating model. For a quant researcher, power answers a planning question: if an economically meaningful edge really existed, how often would this research design produce a rejection?
There is no meaningful standalone claim that “this test has 80% power.” Power must be attached to an effect, a sample size, a noise model, a rejection rule and a significance level.
Fix the rule, then change the truth
Let R be the rejection region and θ the parameter governing the data. The power function is
π(θ)=Pθ(X∈R).
At a specified alternative hypothesisθ1, this is 1−β(θ1), where β(θ1) is the Type II error probability: failing to reject when that alternative is true. The subscript matters. Missing a tiny effect and missing a large effect need not have the same probability.
The same function can be evaluated under the null hypothesis. There it gives a false-rejection probability. A test with significance level α constrains that probability to be at most α across the null. For the exact continuous test below, it equals α at the point null. This is how one decision rule connects false alarms with successful detection; the rule stays fixed while the assumed truth changes.
A real edge can still produce an inconclusive history
Imagine a desk planning a fixed-length evaluation of one strategy, with returns measured in percentage points per observation. Use the deliberately simple model
These are stipulated normal returns, not market observations or a forecast. A value of 0.5 in these units means a return of 0.5%, not 50%. No annualisation is applied. The desk predeclares H0:μ=0 against H1:μ=0, at α=0.05.
For n=100, the sample mean's standard error is σ/n=0.2 percentage points. Under the null,
Z=σ/nXˉ∼N(0,1).
Writing c=Φ−1(0.975)=1.95996398…, the fixed rule rejects when ∣Z∣>c, or equivalently when
∣Xˉ∣>0.3919928 percentage points.
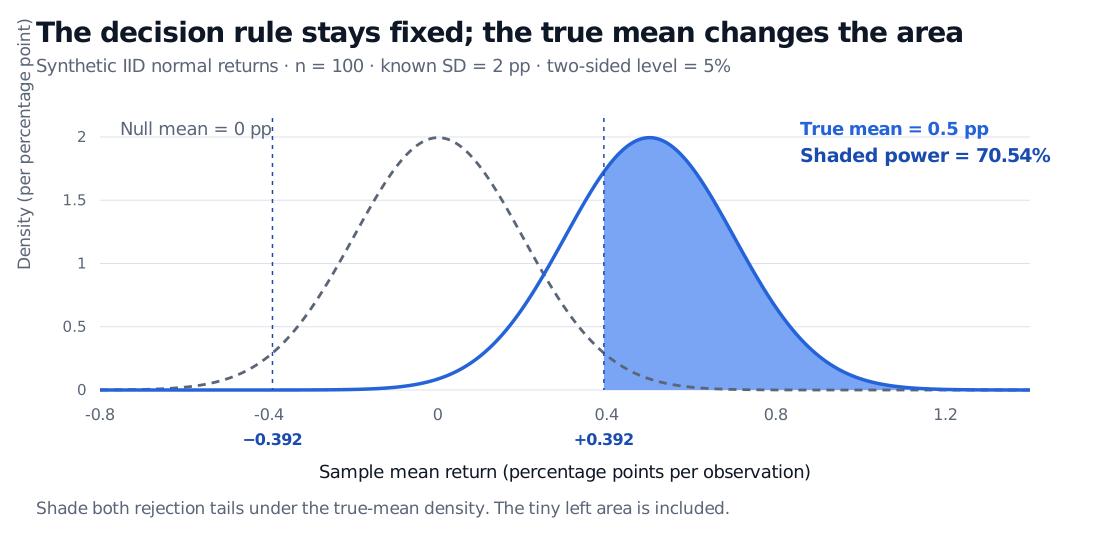
Now suppose the true mean is μ=0.5 percentage points. The statistic is no longer centred at zero: Z∼N(2.5,1). We must calculate how much of this alternative distribution falls beyond the original cutoffs.
Sample-mean null and alternative normal densities for n 100 and known SD 2 percentage points. Fixed rejection cutoffs are minus and plus 0.392 percentage points. Shading under the alternative mean 0.5 distribution gives 70.54% power, including a tiny left tail.
Original model-based illustration. The shaded area belongs to the alternative distribution; its boundary comes from the null. Both distributions have sample-mean SD 0.2 percentage points.
For a general true mean, let d=nμ/σ. With Φ denoting the standard normal distribution CDF, the exact two-sided power is
π(μ)=Pμ(Z<−c)+Pμ(Z>c)=Φ(−c−d)+Φ(d−c).
At d=2.5, the lower-tail probability is approximately 0.000004099 and the upper-tail probability is 0.705413902. Their sum is 0.705418001: 70.54% power, leaving a 29.46% probability of failing to reject despite this genuine positive mean.
The small lower tail is included because this is a two-sided test of departure from zero. A rejection in the negative direction would not support a claim of positive expected return. A test designed specifically for a positive mean uses a different, predeclared one-sided rule.
The design determines what the test can see
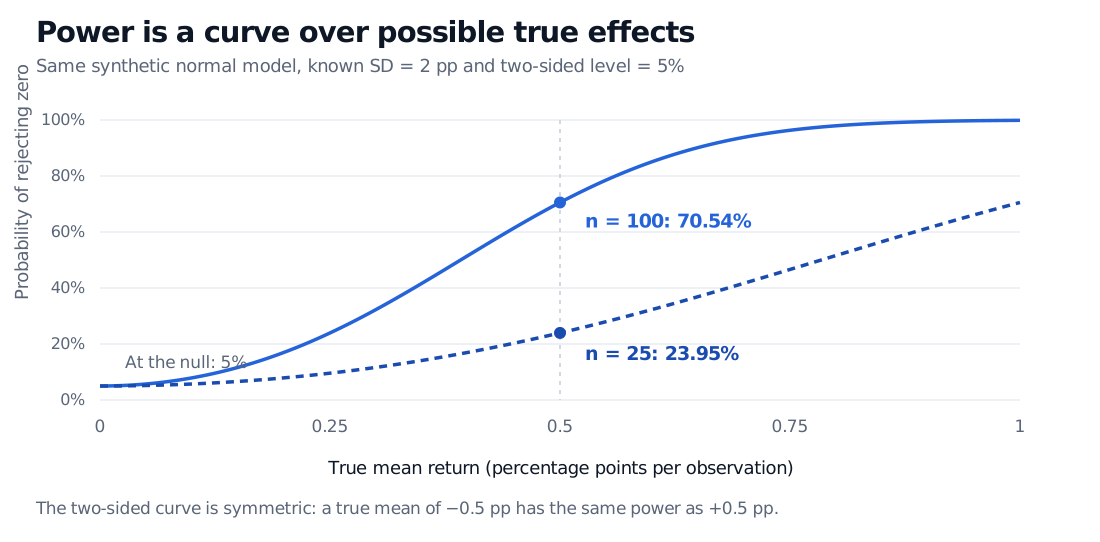
With only n=25, standard error doubles to 0.4 percentage points, the critical sample mean becomes ±0.7839856 percentage points, and the same true mean gives a shift of only 1.25 standard errors. Power falls to 23.95%. Both designs still have a 5% false-rejection probability at zero.
Two-sided power curves for known population SD 2 percentage points and level 5%. At true mean 0.5 percentage points, n 25 has 23.95% power and n 100 has 70.54% power. Both curves start at 5% rejection probability at true mean zero; negative effects have symmetric power.
Original normal-model calculations. The horizontal axis is a possible true mean, not an observed sample estimate. Solid: 100 observations; dashed: 25 observations. At zero, the plotted rejection probability is the false-alarm rate.
For this model, detection improves as the absolute effect size ∣μ∣/σ or the sample size grows. A stricter significance level moves the cutoffs outward and reduces power at a fixed alternative. These trade-offs should be evaluated against effects worth detecting before collecting data; NIST's sample-size guidance makes the desired shift, noise and error rates explicit planning inputs.
More rows help only to the extent that the model's information calculation remains valid. Overlapping returns, serial dependence, unstable means and changing strategies can invalidate the IID calculation. When population SD is estimated from the same normal sample, the exact mean test uses a Student t statistic; its power requires a noncentral t distribution under the alternative. Substituting an estimated SD into this known-SD formula does not preserve exactness.
Read the completed study differently
Power is a repeated-sampling probability conditional on a specified truth. It is neither the probability that the null is false after seeing data nor a probability that the strategy will make money. A 70.54% design does not assign a 70.54% probability of a genuine edge to the eventual backtest.
Nor should a researcher plug the observed sample mean into the true-mean input and report “observed power” as fresh evidence. For this fixed known-SD test, that calculation is determined by the absolute observed statistic, just as the two-sided p-value is; it adds no independent information. Hoenig and Heisey explain why this retrospective interpretation fails. After collecting data, report the estimated effect and its confidence interval, with the test's assumptions and any research selection made explicit.
Finally, adequate power for one predeclared test does not control false discoveries across a search through many strategies. Multiple hypothesis testing changes the decision procedure and therefore its power. A sensible study evaluates detection and false alarms together, for the procedure it will actually use.
For the interval calculations, normal-family testing assumptions and a return-history power example, continue with Confidence Intervals and Hypothesis Testing (membership; public preview).
Sources
Larry Wasserman, All of Statistics: A Concise Course in Statistical Inference, Chapter 10, Definition 10.1 and Example 10.2, pp. 150–152: power functions, test size and known-SD normal-mean testing. Author's book page.