A long straddle buys a call option and a put option on the same underlying, with the same strike price, expiry and matched underlying exposure. It trades the cost of two option premiums for the ability to benefit from a sufficiently large move in either direction. A correct forecast that “something big will happen” can still lose money if that possibility was expensive to buy.
The strike need not equal the current stock price, although straddles are commonly initiated near at the money. Using different put and call strikes instead produces a long strangle.
Two purchases, one recovery hurdle
Consider synthetic European options on one stock, both with strike USD 100 and the same expiry. Buy equal exposure to each leg:
| Entry trade | Premium paid, USD per share-equivalent |
|---|---|
| Buy call, strike 100 | 6 |
| Buy put, strike 100 | 4 |
| Total debit | 10 |
These are stipulated trade premiums, not model prices or live quotes. Hold both options to expiry with no dividends, fees, funding charges, tax or default. Measure net exercise value, without retaining any stock position after settlement.
Let be the terminal stock price. The call pays and the put pays . Only one can have positive exercise value at expiry. Together,
The losing leg does not refund its premium when the other leg wins.
| Stock price at expiry | Call payoff | Put payoff | Combined profit after both premiums |
|---|---|---|---|
| 80 | 0 | 20 | +10 |
| 90 | 0 | 10 | 0 |
| 100 | 0 | 0 | −10 |
| 105 | 5 | 0 | −5 |
| 110 | 10 | 0 | 0 |
| 120 | 20 | 0 | +10 |
All amounts are USD per share-equivalent. Payoff columns exclude premiums; the profit column includes the total debit of 10 once.
At 105, the call finished in the money, but its payoff of 5 recovered only half the combined entry cost. The straddle lost 5.
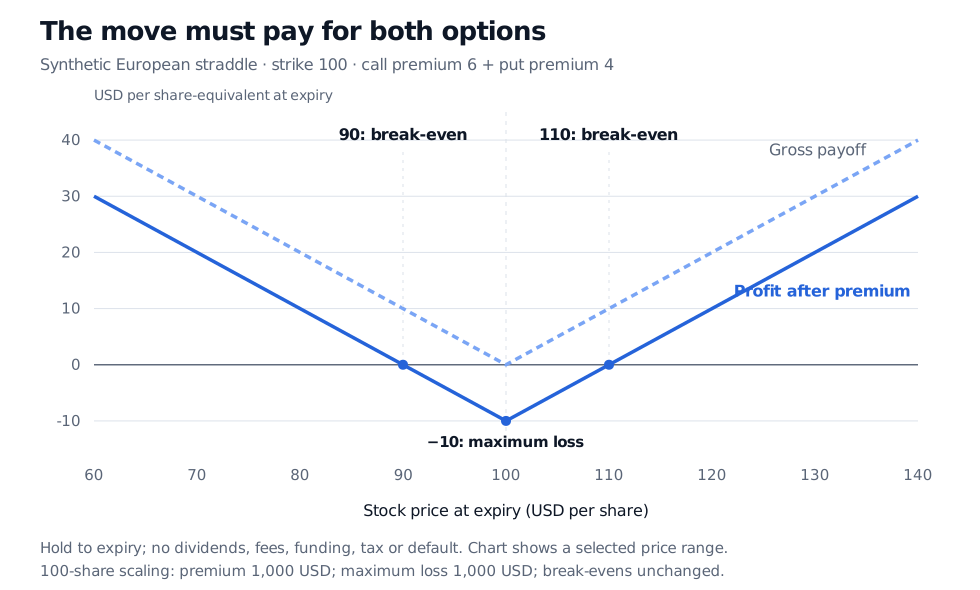
Original synthetic expiry diagram, in USD per share-equivalent. The dashed gross-payoff line excludes premiums; the solid profit line subtracts both premiums. One 100-share call plus one matching put costs USD 1,000 and has maximum loss USD 1,000. The displayed price range is illustrative.
More generally, with common strike and total premium , expiry profit is . The familiar break-even prices are and , provided those prices lie in the underlying's permitted range. Here they are 90 and 110. They measure distance from the strike, which may differ from the entry stock price.
The maximum loss is the debit, 10, attained at . For a stock constrained to nonnegative prices, the downside branch stops at zero: its best profit here is 90. The upside branch has no finite profit ceiling if the stock price is modelled as unbounded above. “Unlimited profit potential” describes that upper branch; it does not mean stock prices can fall without limit.
What “long volatility” does and does not promise
Before expiry, a straddle's market value is the sum of the surviving call and put values. A rise in implied volatility raises both values in the standard European Black–Scholes model, holding other inputs fixed. That positive vega can help a holder sell the position at a profit before expiry. It does not guarantee that the increase outweighs elapsed time, adverse price changes or trading costs. Near-the-money straddles usually suffer time decay; a post-event fall in implied volatility can also reduce their resale value.
For the unhedged position held to expiry, however, the relevant test is simply terminal distance from strike versus total cost. A stock could swing from 100 to 120 to 80 and finish at 100. This straddle still loses the full 10, just like a stock that stayed at 100 throughout. The paths have different realised volatility, but identical terminal payoffs. Trading or delta hedging during the path creates additional cash flows and a different profit calculation.
Nor are the two break-evens a confidence interval or a universal forecast extracted from implied volatility. They come directly from the prices paid. Before an anticipated event, high premiums can already reflect the prospect of a jump. That explains why a large realised move may be insufficient; it does not establish that every event straddle has a negative expected return. OIC's long-straddle guide discusses the competing effects of movement, volatility and time decay.
Recreate the expiry calculation
The public Option strategy designer has a Long straddle preset. Select it, then manually set both strikes to 100, each quantity to one contract, the call entry premium to 6 and the put entry premium to 4. Both legs share the expiry control. The tool uses a 100-share multiplier, so the expiry curve reads −USD 1,000 at 100 and zero at 90 and 110.
Keep the entered premiums fixed when reproducing this example; Use current model prices replaces them. The At expiry curve is the relevant comparison. The scenario curve uses European Black–Scholes prices and chosen remaining time and volatility, so it answers a different question. The tool is available without signing in, but this link requires manual setup. Its calculations exclude fees, bid–ask spreads, funding, margin, early exercise and assignment.
Sources
- Options Industry Council: Long Straddle, especially the construction, break-evens, limited downside branch and pre-expiry volatility discussion.
- John C. Hull, Options, Futures, and Other Derivatives, ninth Global Edition, Pearson, 2018, §12.4, pp. 289–290, including Table 12.5 and Business Snapshot 12.2. The example above is original.