Risk is exposure to adverse outcomes under uncertainty. In finance, those outcomes can include losing money, failing to meet a payment, or falling short of an investment objective. A quant turns that broad idea into a precise question: which position, which outcome, over which horizon, under which assumptions?
A realised loss is an outcome that has occurred. Risk concerns what could happen before the outcome is known. A strategy can carry substantial risk during a profitable run; the absence of a loss so far does not establish safety. Conversely, an uncertain upside move adds to return dispersion even though the investor welcomes it. This is why volatility is a risk measure, rather than the whole definition of risk.
Same average, different stakes
Consider two synthetic investments over the same single period. Returns are simple net returns with no leverage, costs or intervening cash flows. The following are the complete stipulated probability distributions, not two historical observations:
| Distribution | Negative outcome | Positive outcome | Probability of each |
|---|---|---|---|
| A | −5% | +5% | 1/2 |
| B | −20% | +20% | 1/2 |
Both have expected return zero. For A,
But their variances differ. Weighting the squared deviations by the given probabilities gives
Their standard deviations are therefore 5% and 20% for this period. These are population moments of the stated laws: no sample-size correction or annualisation is involved. The variance units are squared decimal returns; standard deviation returns to decimal-return units.
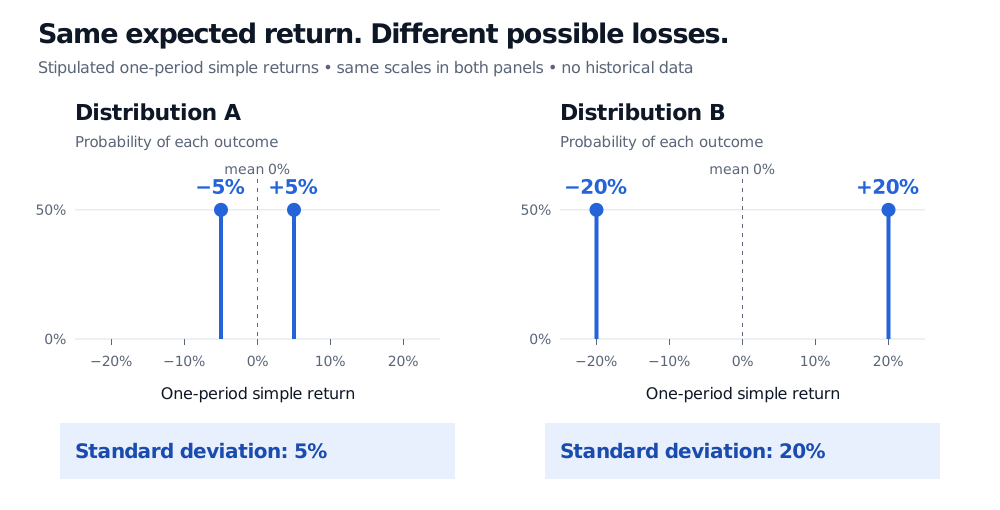
Original synthetic probability distributions, not historical samples. Equal expected returns and equal probabilities of loss conceal different loss sizes.
The probability of losing money is 50% in both cases. If a loss occurs, it is 5% in A and 20% in B. B has four times the standard deviation and a possible percentage loss four times as large. An expected return alone misses both differences; a probability of loss alone misses the severity difference.
This comparison establishes greater dispersion and a larger possible loss for B within these models. It does not tell us which investment has better liquidity, stronger legal protection or more reliable execution. Nor does the mean describe a guaranteed return: neither investment can deliver its zero expected return as an actual outcome.
What a return chart leaves out
The route to an adverse outcome matters because different routes need different controls. These categories can overlap; they are not pieces that can simply be added together.
| Exposure | What can go wrong | A question to investigate |
|---|---|---|
| Market risk | Prices, rates, exchange rates or other market inputs move against the position. | What happens to the whole portfolio when the relevant inputs move together? |
| Credit risk | An issuer or counterparty fails to honour an obligation. | What is owed, what is recoverable, and when? |
| Liquidity risk | An asset cannot be sold promptly without a price concession, or cash is unavailable when an obligation falls due. | Can the position be exited, and can payments or margin calls be funded meanwhile? |
| Model risk | Decisions based on a model lead to adverse consequences because of its limitations, inputs or use. | Which assumptions are critical, and is this use supported by validation? |
| Operational risk | People, processes, systems or external disruptions fail. | Could an incorrect order, outage or settlement error create a loss? |
Market liquidity and funding liquidity are related but distinct: a portfolio may have valuable assets yet lack spendable cash at the required time. A market hedge also does not ensure that the counterparty will pay or the trading system will work. Hull's discussion of derivatives mishaps stresses precisely this danger of treating a theoretical value as cash that can always be realised.
Tail losses are another dimension of the distribution. Volatility treats positive and negative deviations symmetrically and does not specify the probability or severity of extreme losses. Value at risk describes a loss quantile at a stated horizon and confidence level; expected shortfall looks into the adverse tail. Neither replaces a description of the positions, liquidity or model assumptions. The two-point example has no additional outcomes hidden in its tails; real-world tail uncertainty must be investigated rather than inferred from this illustration.
For a deeper treatment of return definitions, non-normal tails and clustered magnitudes, read Financial Return Characteristics. The public page is a preview; the complete lesson requires membership.
Turn the risk statement into a decision
“Low risk” becomes useful only after specifying the exposure and the consequence to avoid. State the holdings and any leverage, the valuation currency, the horizon, the cash obligations and the loss measure. Then explain where the probabilities or scenarios came from and what they omit.
A volatility limit constrains dispersion. A cash buffer addresses funding needs. Diversification can reduce concentration, subject to how exposures behave together; hedging changes selected exposures and can introduce costs or other risks. Stress testing asks how the position behaves in specified adverse conditions, including conditions poorly represented in the observed data. These measures answer different questions, so the useful risk report connects each number to a potential failure and a response.
Sources
- John C. Hull, Options, Futures, and Other Derivatives, 9th Global Edition, Pearson, 2018, §7.12, pp. 198–200, on market versus counterparty credit risk; §22.1, pp. 516–518, on loss quantiles and tail severity; §36.2, pp. 834–836, on liquidity, crowded positions and short-term funding.
- ASIC Moneysmart: Develop an investing plan — Understand investment risks, updated 18 June 2026, for investment objectives, horizon and different investment risks.
- Federal Reserve: Risks in payment, clearing, settlement, and recording systems, for credit, liquidity and operational risk distinctions in financial infrastructure.
- Federal Reserve: Supervisory Guidance on Model Risk Management, interagency guidance of 17 April 2026, particularly §III, for model limitations, materiality and misuse.