A portfolio manager needs that distinction before deciding how much capital to allocate. An investment can have a positive mean and still lose money in a substantial fraction of scenarios. The mean is one input to the decision; the distribution around it determines how uncomfortable, or unaffordable, the investment could become.
Three possible years
Suppose an investor puts USD 10,000 into a hypothetical investment for one year. There are no additional deposits or withdrawals. The scenario returns include all investment income and price changes, but exclude fees and taxes. The probabilities are stipulated for teaching; they are not estimated market forecasts.
| One-year outcome | Probability | Simple return | Terminal wealth | Contribution to expected return |
|---|---|---|---|---|
| Strong year | 20% | +20% | USD 12,000 | +4 percentage points |
| Modest year | 50% | +5% | USD 10,500 | +2.5 percentage points |
| Losing year | 30% | −10% | USD 9,000 | −3 percentage points |
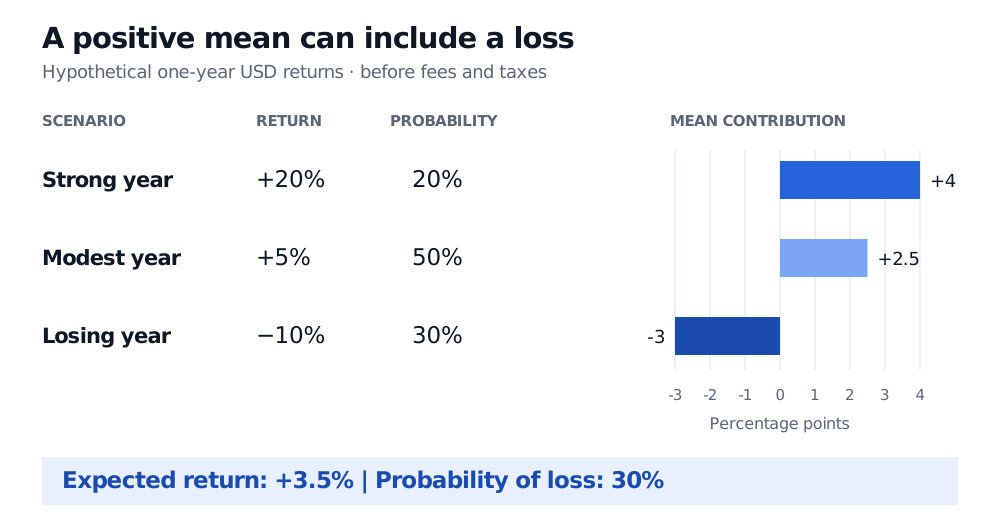
Why expected wealth is USD 10,350
For a fixed initial amount , and terminal wealth , linearity gives
An alternative calculation weights the terminal balances directly:
This is an expected gain of USD 350, not an amount the investor is owed. Imagining ten otherwise identical investors, with two strong years, five modest years and three losing years, produces the same average balance. That small cohort is an arithmetic illustration, not a prediction that ten independent investments must realise those exact counts.
A forecast mean and a historical average have different jobs
For observed returns measured over equal periods, the historical arithmetic mean is
That is a sample statistic. Under an independent, identically distributed model with a finite mean, it estimates the common expected return; a finite sample still has estimation error. A long record also cannot ensure that the future distribution will match the past. Changing borrowing costs, strategy crowding or a different business model can change the relevant mean.
Compounding asks another question
The arithmetic mean concerns a single period’s simple return. A realised multiyear account grows by multiplying gross returns, . With no external flows and equal one-year periods, its compound annual growth rate is
CAGR summarises one realised path. It is not the same object as the forward mean .
Exponentiating gives a growth-equivalent simple rate of about 2.97%. Under repeated independent years with this unchanged distribution and full reinvestment, the long-run realised compound growth rate converges to that rate. This is a model result under those assumptions, not a guaranteed future CAGR. The expected log return itself is approximately 0.02925 in log units per year; calling it a 3.5% simple return would mix conventions.
There is no contradiction between 2.97% compound growth and a 3.5% one-year mean. Taking a logarithm before averaging changes the quantity. Likewise, under those independent repeated-year assumptions, expected terminal wealth after several years uses the arithmetic mean, while a typical long-run compounded path is governed by the log mean. Averaging wealth across possible paths and compounding along one path answer different questions.
Specify what the return includes
A return number needs a horizon, currency and accounting basis. “Expected return of 3.5%” is incomplete unless those are clear. A one-month mean cannot automatically be multiplied by twelve to obtain an annual simple-return mean; compounding and dependence across months matter. A USD return can differ from the same investment’s return after conversion into another currency.
Sources
- Dimitri P. Bertsekas and John N. Tsitsiklis, Introduction to Probability, 2nd edition (2008), §2.4, “Expectation, Mean, and Variance”: probability-weighted expectation and its interpretation.
- John C. Hull, Options, Futures, and Other Derivatives, 9th edition, Global Edition, §15.3, “The Expected Return,” and Business Snapshot 15.1: the distinction between arithmetic returns, expected continuously compounded returns and realised compound performance. The discrete scenarios above are original and do not assume Hull’s continuous-time stock model.
- OpenStax, Principles of Finance, §15.1: total return includes income and capital gains; historical arithmetic averages differ from geometric growth.
- SEC, “How Fees and Expenses Affect Your Investment Portfolio”, July 23, 2025: transaction and ongoing fees reduce investment returns.