Dividend yield compares annual cash dividends with the current share price. Distinguish trailing and indicated yields, a falling-price effect, and total investment return.
Dividend yield
Dividend yield is annual cash dividends per share divided by the share's current market price. It expresses dividend income relative to the price of a stock, usually as a percentage. The numerator may describe past payments or an annualised estimate, so a useful quote states which one it uses.
A dividend is a distribution to shareholders. A 5% dividend yield does not promise a 5% investment return: the company may change the dividend, and the share price may fall. FINRA's stock guide distinguishes dividends from price gains and explains that common-share dividends can be cut or eliminated.
Two yields on the same share
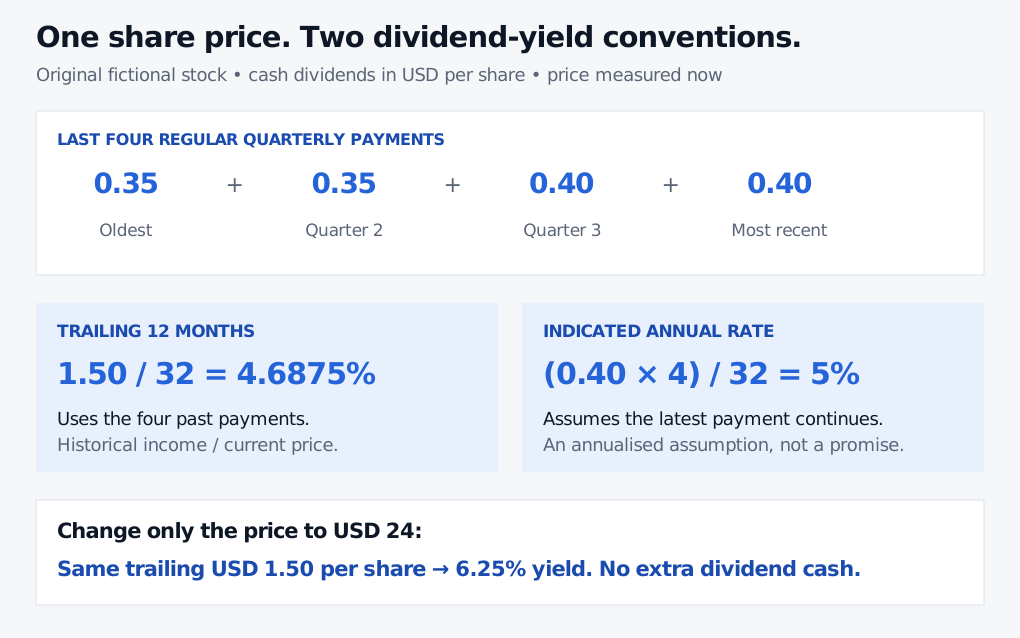
A fictional company's common shares trade at USD 32 per share. Over the last twelve months, that same share class paid four regular quarterly cash dividends:
Payment, oldest to newest
Cash dividend per share
First quarter
USD 0.35
Second quarter
USD 0.35
Third quarter
USD 0.40
Most recent quarter
USD 0.40
The trailing twelve-month dividend yield uses the payments already made:
The difference between 4.6875% and 5% comes from the numerator, not from a different stock price. The indicated figure assumes an unchanged payout schedule and amount. It is not a guarantee, and it need not equal an analyst's forecast of the next year's actual dividends.
Past quarterly cash dividends of USD 0.35, 0.35, 0.40 and 0.40 sum to USD 1.50. At USD 32 per share, trailing yield is 4.6875%; annualising the latest quarterly payment gives indicated yield 5%. At USD 24, the same trailing USD 1.50 gives 6.25%.
Original fictional illustration. Trailing yield uses past cash payments; indicated yield repeats the latest regular payment as an assumption. The bottom comparison changes only the price denominator.
Providers sometimes use “forward yield” for an indicated figure and sometimes for forecast dividends. Read the definition before comparing screens. Fidelity's explanation describes the trailing-payment and annualised-latest-payment approaches.
A rising yield can come from a falling price
Keep the same historical USD 1.50 annual cash dividend per share, but suppose the current quote is USD 24 rather than USD 32. The trailing yield becomes
241.50=6.25%.
No extra dividend cash has appeared. The denominator has fallen. A high yield can therefore reflect a low share price, including concern about the company's outlook or future dividends. Yield alone does not establish that a share is cheap or that its payout is sustainable.
Compare like with like: the same share class, the same currency, a stated price date and a consistent dividend window. Adjust historical per-share payments for stock splits when necessary. Say whether special, one-off dividends are included; multiplying a special payment by four does not turn it into recurring quarterly income. Dividend yield also differs from a payout ratio, which compares dividends with earnings rather than with the share price.
Income and total return tell different stories
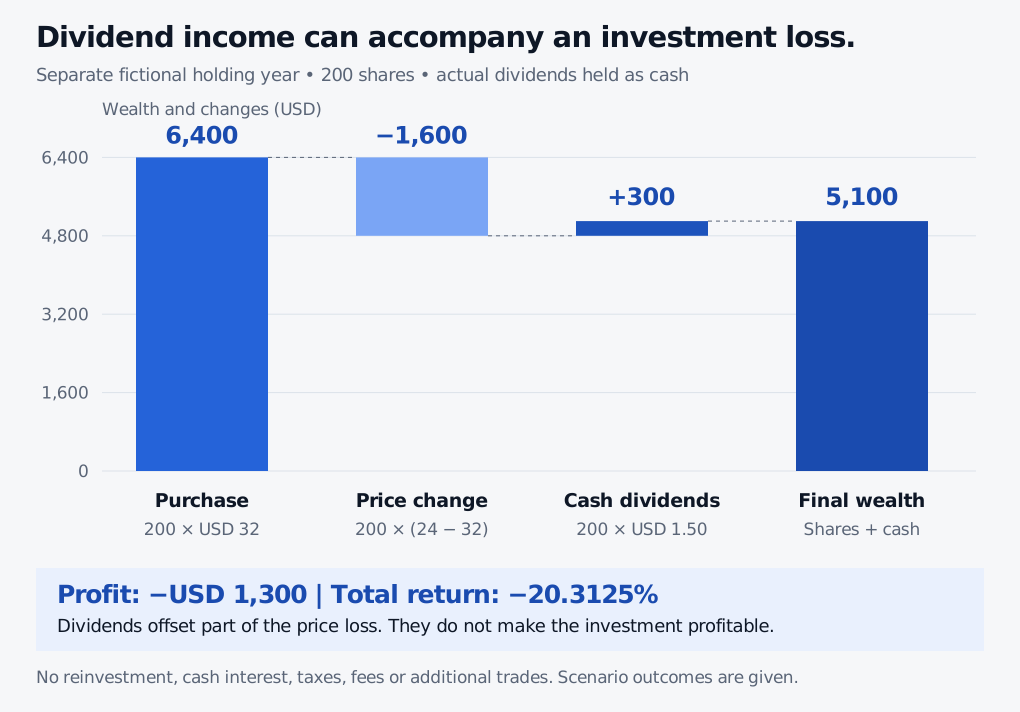
Consider a separate, completed one-year investment in the fictional share. An investor bought 200 shares at USD 32. Over that holding year, the investor actually received USD 1.50 per share in cash dividends, and the year-end price was USD 24. These are given outcomes; the dividend receipt is not inferred from the previous trailing history.
Assume the dividends stayed as cash, earned no interest and were not reinvested. Ignore taxes, fees and further trades. Then:
Purchase cost: 200(32)=USD 6,400.
Year-end share value: 200(24)=USD 4,800.
Cash dividends received: 200(1.50)=USD 300.
Final wealth: 4,800+300=USD 5,100.
The investor lost USD 1,300. The total return, including dividends, is
R=P0P1−P0+Dreceived=3224−32+1.50=−20.3125%.
Here P0 is purchase price, P1 is final price, and Dreceived is actual dividends per share over the holding period. The dividend contribution is positive; the total result is negative.
Separate fictional holding year: 200 shares bought at USD 32 cost USD 6,400. The price fall to USD 24 removes USD 1,600. Actual dividend cash adds USD 300. Final wealth is USD 5,100, a USD 1,300 loss and minus 20.3125% total return.
Original holding-year waterfall. Solid total bars measure wealth; floating bars measure the price change and cash income. Dividends remain separate cash, without reinvestment or interest.
The dividend is part of the share's value
Buying just before an ex-dividend date does not create free income. Before the entitlement separates, the share includes the right to the declared dividend. Afterwards, a new buyer generally buys without that right. The SEC's ex-dividend guide explains entitlement; the issuer's announcement and applicable market rules govern the dates.
In a theoretical example with everything else unchanged, no taxes or trading frictions, and ignoring the short wait until payment, a USD 32 share going ex a USD 0.40 cash dividend becomes a USD 31.60 share plus a USD 0.40 dividend entitlement. Combined value is still USD 32. The cash is paid on the payment date, not necessarily the ex-date. Actual traded prices also respond to news and order flow, so they need not fall by exactly the dividend.
For this price-and-cash accounting, continue with SelfMadeQuant's Equities lesson. Equities, Indices and Corporate Actions goes further into the dividend calendar, historical price adjustments and stock indices. Both pages have public previews; full lessons require membership.
When a pricing model writes “dividend yield”
In the Black–Scholes model and some equity carry formulas, q denotes a continuous dividend yield: a modelled stream paid in proportion to the stock's changing value. That is a different convention from a historical annual cash sum divided by today's price. Setting q equal to the trailing yield requires a modelling assumption about future payments and their timing. A stock with discrete cash dividends may instead need an explicit dividend schedule.
Practice
1. Which yield is on the screen? A fictional share trades at USD 18. Its last four regular quarterly cash dividends were USD 0.20, 0.20, 0.25 and 0.25 per share, oldest to newest. Calculate its trailing twelve-month yield and its indicated yield assuming the latest quarterly payment continues unchanged.
Answer. Past payments total USD 0.90, so trailing yield is 0.90/18=5%. Annualising the latest payment gives USD 1.00 and an indicated yield of 1/18≈5.5556%. The larger indicated figure uses a different annual dividend amount; neither figure guarantees future payments.
2. Did the dividend prevent a loss? An investor buys 50 shares at USD 20, receives USD 0.60 per share in actual dividends over the next full year, and finishes with shares worth USD 19 each. Dividends remain cash without interest or reinvestment. Ignore taxes and costs. Calculate the profit and total return.
Answer. The share-price loss is 50(19−20)=−USD 50 and the dividend income is 50(0.60)=USD 30, giving a net loss of USD 20. On the USD 1,000 purchase cost, total return is −20/1,000=−2%. The dividend offsets part of the capital loss; a positive dividend payment does not ensure a positive total return.