A quantitative researcher turns financial ideas into testable models. Learn how hypotheses, uncertainty, independent evidence and trading costs shape the conclusion.
Quantitative researcher
A quantitative researcher develops and tests mathematical or statistical models for financial decisions. The work may concern investment signals, pricing, risk, portfolio construction or execution. Its practical purpose is to determine which claims the evidence supports before a model influences money at risk.
The researcher's central product is a defensible conclusion: a clearly specified question, a reproducible experiment and an explanation of what would change the decision. A profitable historical chart can be part of that evidence, but it cannot substitute for it.
From an interesting pattern to a research question
Consider an investment researcher who notices that a price decline is often followed by a rebound. “Buy after a fall” leaves too much unspecified to test. Which securities qualify? When is the fall measured? At what price can the strategy enter? What is the holding period? What simpler strategy provides a fair comparison?
A usable hypothesis could be: Among a predefined set of liquid securities, a signal calculated from information available before the decision predicts returns over a specified subsequent interval, beyond a comparable baseline, after realistic costs. The researcher must fill in those definitions before treating a result as confirmation. The economic explanation might be temporary selling pressure; competing explanations include compensation for risk, stale prices or a handful of unusual episodes.
Backtesting then becomes an experiment about a specified policy, rather than a search for an attractive curve. The measurement must respect what was knowable at the time: using a later data revision or an unavailable closing price introduces look-ahead bias. Keeping only securities that survived to the present creates survivorship bias.
For a worked way to specify the mechanism, timing, baseline and rejection conditions, see Economic Mechanisms and Falsifiable Hypotheses. Its preview is public; the full lesson requires membership.
A positive average is the start of the interpretation
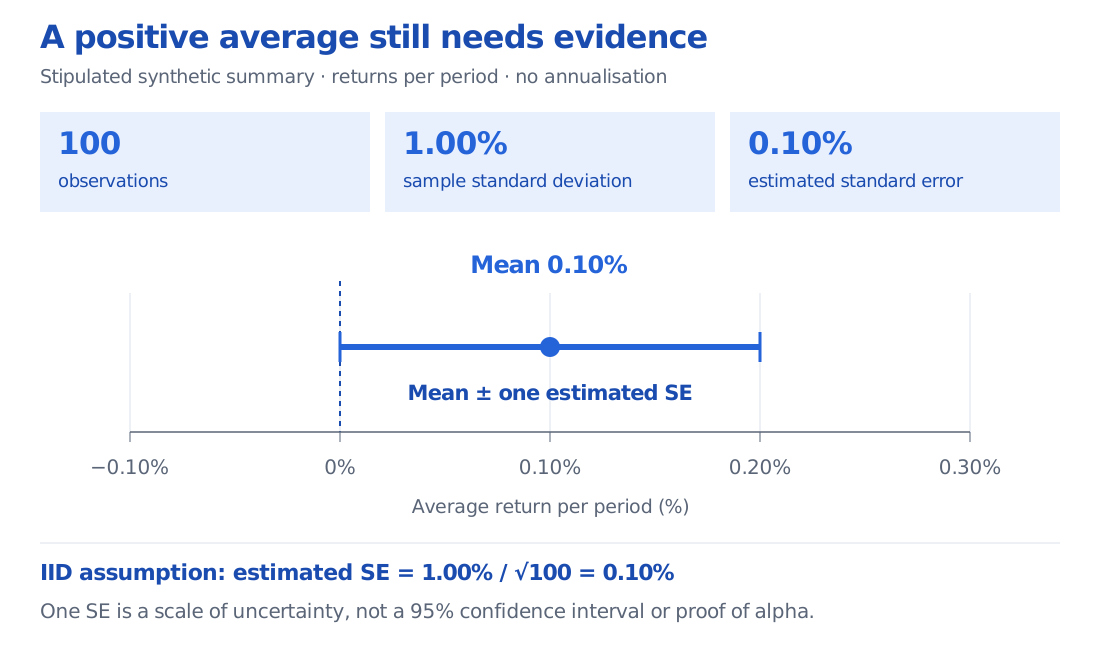
Suppose a candidate's stipulated synthetic summary contains 100 non-overlapping period returns, with arithmetic sample mean 0.10% per period and sample standard deviation 1.00%. These are illustrative inputs, not market observations or evidence of a real opportunity. Assume for this calculation that observations are independent and identically distributed, with finite variance. Non-overlapping periods alone do not establish independence.
Here s measures dispersion across individual period returns; the estimated standard error measures uncertainty in the sample mean under the stated assumptions. Both use return units, but they answer different questions. The mean is 0.001 in decimal units, not 0.10; its distance above zero is 0.10 percentage points.
Against a zero-mean reference, the conventional standardized mean statistic is
t=s/nrˉ−0=0.0010.001=1.
The observed mean is only one estimated standard error above zero. This is neither a probability that the strategy works nor proof of statistical significance. No p-value is assigned here: interpreting the statistic through a reference distribution needs distributional or asymptotic assumptions, and the experiment's selection process also matters. The calculation itself says nothing about a guaranteed future return or alpha.
Synthetic summary of 100 observations with sample mean 0.10% per period, sample standard deviation 1.00%, and IID estimated standard error 0.10%. The segment from 0% to 0.20% shows the mean plus or minus one estimated standard error, not a 95% confidence interval.
Original uncertainty-scale diagram for the stipulated synthetic summary. The segment is mean ± one estimated standard error under an IID assumption; it is not a confidence interval with a stated coverage level.
A researcher next challenges the denominator and the provenance of the numerator. Serial dependence or overlapping outcomes can make the IID standard-error formula inappropriate. If many candidates were tried and only the winner is reported, data snooping and overfitting make the selected result less informative than an independently specified test. Bailey and co-authors' backtest-overfitting research examines this selection problem; a single candidate's summary does not reveal the search that produced it.
Preserve a test that can disagree with you
Exploration is legitimate. Researchers inspect errors, invent features and revise models. The distinction to preserve is between data used to make those choices and data used to assess a frozen procedure.
For time-dependent financial data, a validation design must respect chronology and prevent training outcomes from leaking into later evaluation. “Out of sample” describes the relationship between the data and the entire selection process. A period can be outside a model's fitting window while still having influenced feature choices or the choice of model.
Suppose a candidate fails on a held-out period. The researcher studies that failure, changes a filter and obtains a better result on the same period. The change may be sensible research, but that period is now development evidence for the revised candidate. It cannot provide the same independent confirmation. Record the revision and seek genuinely unobserved evidence under a frozen protocol. A fresh test also has uncertainty and may cover only one market environment.
Transaction costs, financing, borrow availability, execution delays and market impact belong inside the economic evaluation. A forecast can contain information while the proposed trades lose money after implementation. The main synthetic summary above does not specify a trade ledger or cost model, so it cannot establish investability.
A useful report retains the data version, timing rules, candidate history, validation boundaries and cost assumptions alongside the results. Quant Research Dossier develops that evidence package and a bounded recommendation. The preview is public; the full lesson requires membership.
Where the role overlaps other quant jobs
A quantitative analyst is a broader title that may include research, pricing or independent model validation. A quantitative developer often focuses on dependable software and data infrastructure. A quantitative trader often focuses on execution, live exposures and trading decisions. Researchers also code, developers contribute to experiments and traders challenge models: employers divide the responsibilities differently.
Jane Street's researcher description is one concrete employer example, covering experiment design, financial datasets and model building in collaboration with engineers and traders. Carnegie Mellon's career overview places research within a wider set of quant roles. Neither establishes a universal job boundary.
Good research can end in rejection. It can also justify more measurement, a revised hypothesis or a controlled next stage. The conclusion should say what failed, what remains uncertain and which new observation would change it. Even after deployment, changing costs, market conditions or model behaviour can require the researcher to revisit the evidence.
Sources
Rishi K. Narang, Inside the Black Box: A Simple Guide to Quantitative and High-Frequency Trading, 2nd edition, Wiley, 2013, Chapter 9, pp. 147–149 and 167–170: research scope, hypothesis testing, reused test data and implementation assumptions.
Jane Street, Quantitative Researcher, London, accessed 25 October 2026: an employer example of research tasks and collaboration across research, engineering and trading.
Carnegie Mellon University MSCF, How to Become a Quant, 1 July 2024: the range of quantitative finance career functions.
NIST/SEMATECH, e-Handbook of Statistical Methods, §1.3.5.2: the sample-mean standard-error expression and one-sample standardized mean statistic. The article's synthetic calculation does not infer a p-value or claim significance.
David H. Bailey, Jonathan M. Borwein, Marcos López de Prado and Qiji Jim Zhu, The Probability of Backtest Overfitting, author-hosted February 2015 version, §1: selection across strategy configurations and the limits of an isolated backtest result.