Measure trading costs from a signed benchmark and fill ledger: spread, book walking, explicit fees, delay and non-fills, without charging the same friction twice.
Transaction cost
Transaction cost is the economic cost of implementing a trade, including explicit charges and the difference between actual execution and a stated reference price. A broker can charge no commission while the trade still costs money through the bid–ask spread, limited depth and price movement before completion. This matters whenever a small forecast edge must survive contact with the market.
The first question is “cost relative to what, measured when?” A fill compared with the arrival mid-price answers a different question from the same fill compared with the best ask, the decision-time price or the day's market VWAP. The CFA Institute's execution overview distinguishes these benchmarks and the costs of delay, execution and non-completion.
A 1,000-share purchase leaves a USD 69 gap
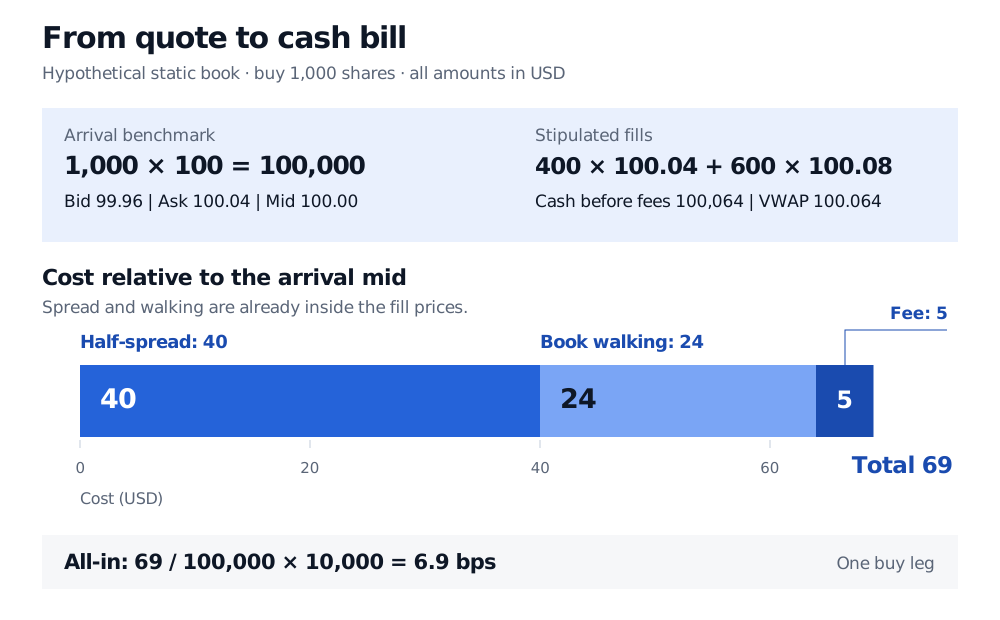
Suppose a portfolio manager wants to buy 1,000 shares. At order arrival, the bid is USD 99.96, the ask USD 100.04, and their midpoint USD 100.00. The hypothetical static order book offers 400 shares at 100.04 and another 600 at 100.08. For this arithmetic, stipulate that both quantities remain available and are filled completely; these are invented fills, not a promise about live execution.
Fill
Shares
Price, USD/share
Cash paid, USD
Best ask
400
100.04
40,016
Next ask level
600
100.08
60,048
Total
1,000
Average 100.064
100,064
The quantity-weighted average fill price is
pˉ=1,000400(100.04)+600(100.08)=100.064.
This is the VWAP of our fills, not the market's VWAP over a trading interval. Buying instantly at the arrival mid would have cost USD 100,000. The fill-price difference is therefore USD 64, before fees. Decompose it without overlapping terms:
Half-spread costBook-walking costTotal versus mid=1,000(100.04−100)=40,=600(100.08−100.04)=24,=40+24+5=69 USD,
where the final USD 5 is an assumed commission. Cash actually paid is USD 100,069. On the USD 100,000 benchmark notional, the all-in cost of this one buy leg is
100,00069×10,000=6.9 bps.
A hypothetical 1,000-share purchase at arrival mid USD 100 fills 400 at 100.04 and 600 at 100.08. Its USD 69 cost comprises 40 of half-spread, 24 of book walking and 5 commission: 6.9 basis points of USD 100,000 benchmark notional.
Original hypothetical static-book example, one buy leg. Complete fills are stipulated. The spread and walking costs are already contained in the fill prices; only the commission is an additional cash charge.
Relative to the arrival ask, the same fills cost USD 24 before commission. Relative to the arrival mid, they cost USD 64 before commission. Both statements are correct. Reporting “24 dollars of slippage” without its benchmark hides USD 40 of the execution cost versus mid.
Nor does the USD 24 prove a lasting market impact. It is the cost of consuming deeper displayed offers in this frozen book. In a moving market, a fill-versus-benchmark difference also reflects other traders, news and delay; identifying the price movement caused by our order requires a counterfactual or an explicit model.
Use the trade direction to get the sign right
Let qi>0 be the shares in fill i, pi its price, pb a reference price recorded at the specified benchmark time, and F separate explicit charges. Set ε=+1 for a buy and ε=−1 for a sell. For executed quantity Qf=∑iqi, define the signed benchmark cost as
Cb=εi∑qi(pi−pb)+F=εQf(pˉ−pb)+F.
A buyer paying above the benchmark and a seller receiving below it both incur a positive price cost. A favorable fill can produce a negative price component; that is benchmark outperformance, not a refund from the exchange. For Qf>0 and pb>0, dividing by Qfpb and multiplying by 10,000 expresses this executed-quantity measure in basis points. If nothing fills, there is no average fill price and this denominator is zero.
Keep the attribution separate from cash accounting. A backtest that buys these shares at 100.064 has already paid the USD 64 difference through its fill prices. Deducting USD 64 again as “spread plus slippage” charges it twice. An alternative simulation can fill at the benchmark and deduct a cost model, provided the two representations reconcile. Similarly, do not add a separate spread or impact estimate to a slippage number that already includes it.
A cheap fill can still be an expensive decision
A fill-only measure ignores the part of the instruction that never trades. Implementation shortfall broadens the comparison: how much worse did the actual implementation perform than an ideal paper trade at the decision price?
For intended quantity Q, decision price pd, filled quantity Qf≤Q, and a declared evaluation-horizon mark ph, a simple one-asset, no-carry comparison is
IS=εi∑qi(pi−pd)+ε(Q−Qf)(ph−pd)+F.
The first term is the cost on executed shares. The second marks the unexecuted quantity against the decision-price paper trade. A buyer who misses a rally has positive opportunity cost; a buyer who misses a fall has negative opportunity cost under this convention. This is a counterfactual performance difference, not a cash payment. All quantities share the same evaluation horizon, and this simplified expression omits financing and intervening distributions.
To split delay from execution on the filled shares, insert an arrival benchmark pa:
εi∑qi(pi−pd)=εQf(pa−pd)+εi∑qi(pi−pa).
State precisely whether arrival means release by the trading desk or receipt at a venue, and which quote supplies the price. A timestamp label alone does not identify a common benchmark across systems.
Limit orders can constrain execution price but introduce non-completion risk. FINRA explains that a limit order may never execute. A favorable displayed limit price is not an earned saving until the trade happens, and an aggressive order does not guarantee unlimited quantity at the current quote.
Charge trading, capital and stock borrow on their own clocks
Commission, exchange and clearing charges, and applicable transaction taxes attach to executions under the relevant schedule. Rebates can offset some charges, but the applicable venue and account terms must determine the sign.
Funding and stock-borrow charges are different: they accrue on cash balances or borrowed securities over a holding interval. They belong in the strategy's net economics, with their own exposure base, rate and day-count convention. A short also needs an available borrow; adding a fee cannot make an unavailable loan feasible. An execution-cost number alone is therefore not a complete estimate of the cost of running a position.
For the detailed ledger treatment, read Financing, Borrow and Transaction Costs. Its full lesson requires membership; the public page provides a preview. It develops traded-notional costs, carrying-cost accrual, borrow feasibility and break-even charges.
For a visual experiment, the public Order-book simulator lets you compare market and limit orders across Thin, Normal and Deep books, then advance simulated market events. It accepts 1–200 shares and uses its own preset books, so it is a separate experiment from the 1,000-share example above. Its displayed slippage is relative to the pre-trade touch, and its paper account omits fees and margin. Use it to see depth and non-fills; add a separate ledger when evaluating total strategy cost.
In backtesting, report the benchmark, side, intended and filled quantities, timestamps, fill prices and explicit charges together. Stress spread, delay, liquidity and non-fills as well as the fee rate. A constant basis-point deduction can be a useful first approximation, but it cannot establish that larger orders will remain affordable or executable.
Sources
Rishi K. Narang, Inside the Black Box: A Simple Guide to Quantitative and High-Frequency Trading, 2nd edition (2013), Chapter 5, “Transaction Cost Models,” pp. 79–85, especially “Defining Transaction Costs.” Distinguishes fees, decision-to-arrival slippage and impact, and discusses their measurement overlap. This article states its broader benchmark-based terminology explicitly; examples and figure are original.