Understand the gap between bid and ask, convert it to basis points, and separate quoted, effective and realised spreads from one-way trading costs and market-maker profit.
Bid-ask spread
The bid-ask spread is the difference between the lowest quoted selling price, the ask or offer, and the highest quoted buying price, the bid, for the same instrument at a stated time. A trader who demands immediate execution usually buys from an offer or sells into a bid. The gap is one reason a strategy can predict prices correctly and still lose money after trading.
The prices must describe a meaningful market reference: one venue's best quotes, for example, or a consolidated best bid and offer. A spread assembled from different instruments, stale observations or incompatible timestamps does not describe an executable opportunity.
A four-cent gap is not an eight-dollar round trip
Imagine a research desk testing a signal in a hypothetical stock. At its observation time, the quote is:
Quote component
USD per share
Best bid b
99.98
Best ask a
100.02
Midpoint m=(a+b)/2
100.00
The full quoted spread is
sQ=a−b=100.02−99.98=0.04USD per share.
To compare instruments at different prices, express that gap relative to the midpoint in basis points:
sQ,bps=104ma−b=1041000.04=4bps.
Assume enough shares are available at both best prices, with no price change, fees or other charges. The desk buys 100 shares at the ask, paying USD 10,002, then immediately sells 100 at the unchanged bid, receiving USD 9,998. Its loss is USD 4. The complete round trip crosses one full spread per share.
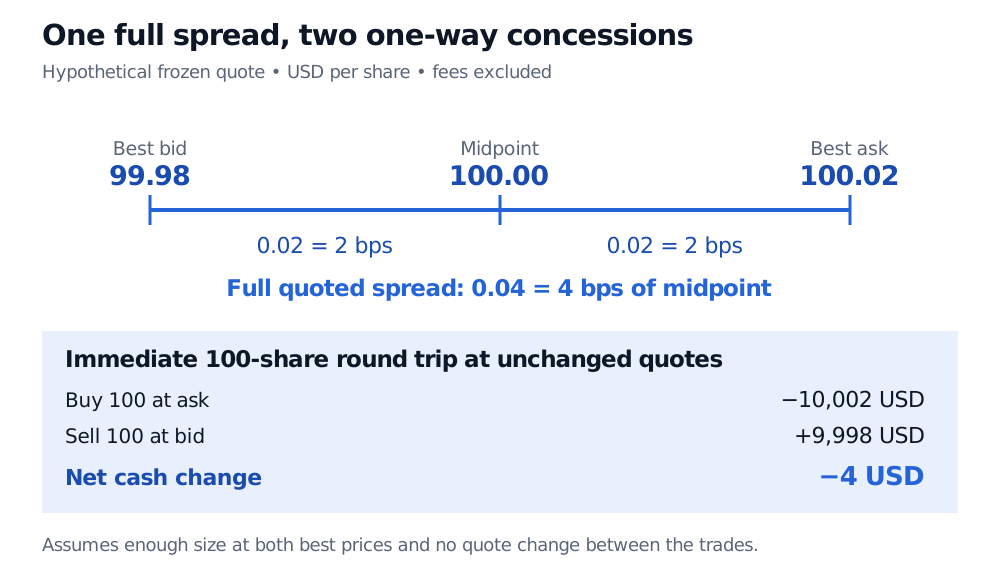
Why not USD 8? The full spread already spans both sides of the midpoint. A purchase at the ask is a USD 0.02 one-way concession relative to the midpoint; a sale at the bid makes the other USD 0.02 concession. Each leg costs 2 bps of midpoint notional. Charging the full 4 bps on each leg counts the gap twice.
Hypothetical bid USD 99.98, midpoint 100 and ask 100.02. Each half-spread is 2 bps; full spread is 4 bps. Buy 100 shares for USD 10,002 and sell for USD 9,998: net loss USD 4 before fees.
Original frozen-quote example, USD per share. Enough quantity is assumed at both best prices; the midpoint and quotes do not move.
This half-spread shortcut is conditional. It describes a small aggressive trade at the touch, measured against the contemporaneous midpoint. It does not estimate a later exit cost, a fee, a large order's depth cost or the return on capital committed to a strategy. The midpoint itself is a reference price; it need not be a price at which the desk can trade.
The fill determines the effective spread
A quote describes an available price schedule; an execution records what happened to an order. A trade can receive price improvement inside the gap, consume several levels, or arrive after the quote changes. Effective spread compares the fill with a declared midpoint benchmark.
Let p be the execution price and let d=+1 for a buyer-initiated trade and d=−1 for a seller-initiated trade. We use the signed full-spread convention:
sE=2d(p−m),sE,bps=104m2d(p−m).
The SEC's effective-spread discussion uses this factor of two and reverses the price difference for a sell. Here m is the synchronized initial benchmark for the example. In an empirical report, specify whether that benchmark is taken at order receipt, arrival or just before execution; those clocks can produce different answers.
Suppose a separate hypothetical market buy receives an average fill of USD 100.025 against the same initial midpoint of USD 100. Then
sE=2(100.025−100)=0.05USD per share=5bps of initial midpoint.
Its actual one-way concession is USD 0.025 per share, or 2.5 bps. For 100 shares that is USD 2.50, before charges. The reported 5-bps full effective spread is twice that concession; multiplying it by the position's notional would overstate the one-way cash cost.
With the same valid benchmark, a buy at the ask or a sell at the bid has an effective spread equal to the quoted spread. A fill at the midpoint gives zero. A buy below the midpoint or sell above it gives a negative signed value. Price improvement relative to the ask or bid can occur while effective spread remains positive; improvement need not cross the midpoint. Other datasets use absolute values or omit the factor two, so read the convention before comparing their statistics.
Later prices answer a different question
Now let mh be the midpoint 60 seconds after execution, a horizon chosen before evaluating the trade. The full realised spread is
sR(h)=2d(p−mh).
For the hypothetical buy at 100.025, suppose the later midpoint is 100.04. Its realised spread is 2(100.025−100.04)=−0.03 USD per share, or −3 bps using the initial midpoint denominator. The liquidity provider sold below the subsequent midpoint. This is the kind of exposure studied under adverse selection.
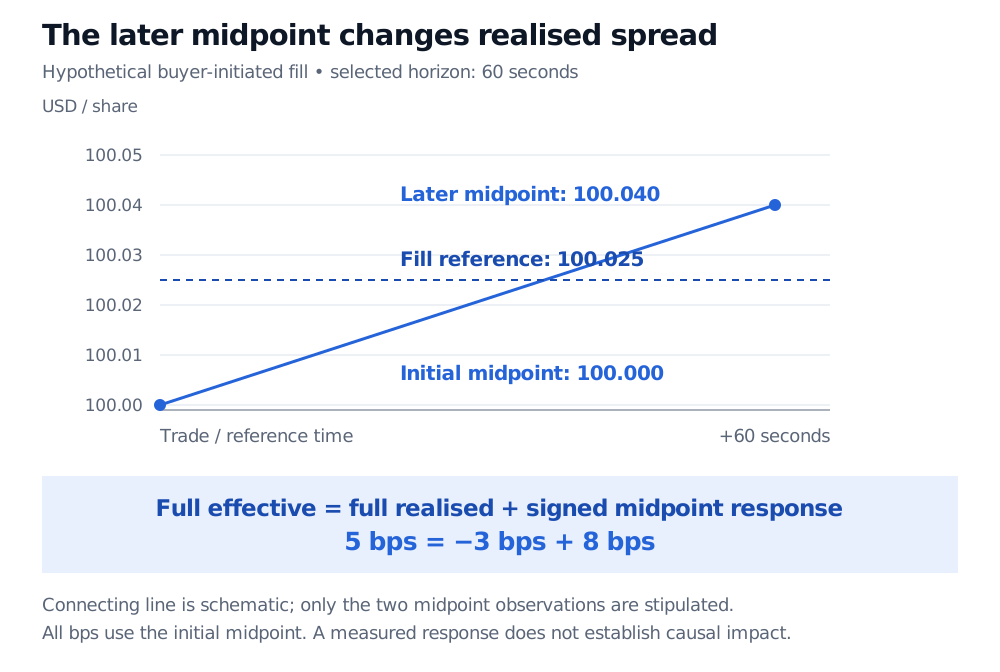
Here it reads 5 = −3 + 8 bps. Keep the same midpoint denominator and units across all three terms. The observed response may include news, other orders and broader market movement; calling it market impact does not identify how much this order caused.
Hypothetical buy fill 100.025 against initial midpoint 100 has full effective spread 5 bps. At 60 seconds, midpoint 100.04 gives full realised spread minus 3 bps and signed midpoint response 8 bps: 5 equals minus 3 plus 8.
Original hypothetical midpoint comparison. The connecting line is schematic. All three measures use full-spread units and the initial midpoint denominator.
Realised spread depends on the horizon: one second and one minute can tell different stories. The SEC's 2024 execution-information release, §III.B.4(a) discusses several horizons rather than treating five minutes as a universal definition. Our 60-second choice is an example, not a claim about every dataset's reporting rule.
Nor is realised spread a market maker's realised profit. It is a doubled, midpoint-based mark for a particular fill. It omits fees or rebates, hedging, financing, the rest of the inventory and actual closing transactions. A later midpoint is not proof that the provider could unwind at that price. Market making requires managing those exposures as well as posting two prices.
The price gap does not tell you the size
A narrow spread is one dimension of liquidity. It says little about how many shares can trade there, how quickly quotes may disappear, or how much a large order will pay. The order book supplies displayed depth; hidden orders, competing flow, cancellations and routing still limit what can be inferred from a snapshot. A passive limit order also gives up immediate execution: avoiding a quoted spread does not guarantee a fill or a favourable subsequent price.
Use the free public Order-book simulator to examine the distinction. Select Deep, then a market buy of 100 shares, before advancing a market event. Predict that it trades now and enter 100.024 as the average fill. The initial offers supply 80 shares at 100.02 and the next 20 at 100.04:
pˉ=10080(100.02)+20(100.04)=100.024.
Against the initial midpoint of 100, that corresponds to a 4.8-bps full effective spread, although the quoted spread began at 4 bps. The simulator's average-execution display rounds to two decimal places; the weighted calculation retains the extra precision. Its quantity control accepts 1–200 shares, and its paper account omits fees and margin. This is a separate preset example from the hypothetical 100.025 fill above.
For a deeper treatment, Spread Measurement develops the definitions, aggregation and estimation; Order Books explains depth and queue priority. Both have public previews, with full lessons requiring membership. When estimating a strategy's transaction costs, retain the trade side, size, quote source, timestamps and benchmark. A spread is useful precisely when its meaning survives the move from a displayed quote to the execution being evaluated.
Narang, R. K. (2013), Inside the Black Box, 2nd ed., Chapter 5, “Defining Transaction Costs,” “Slippage” and “Market Impact,” pp. 80–84: practical costs, timing and the difficulty of separating an order's effect from concurrent price movement.