See why a tight spread does not guarantee a cheap trade. Walk a fictional order book, compare depth at identical quotes, and distinguish market from funding liquidity.
Liquidity
Liquidity is the ease of buying or selling an asset in the size and time you need, at an acceptable trading cost. In a liquid market, finding the other side requires relatively little price concession or delay. In an illiquid market, you may have to accept a worse price, wait, reduce the order, or find that no executable counterparty is available. The SEC's definition emphasises ease, speed and the effect of trading on price.
The useful question is therefore specific: how much can I trade, how quickly, and at what cost? A market can be liquid for a small order and difficult for a much larger one.
The quote is only the start
Consider a fictional stock's displayed order book. Buyers' resting orders are bids; sellers' resting orders are asks. Prices below are USD per share, and quantities are shares available at that price.
Bid price
Bid quantity
Ask price
Ask quantity
99.90
200
100.10
100
99.80
300
100.20
400
99.50
500
100.60
500
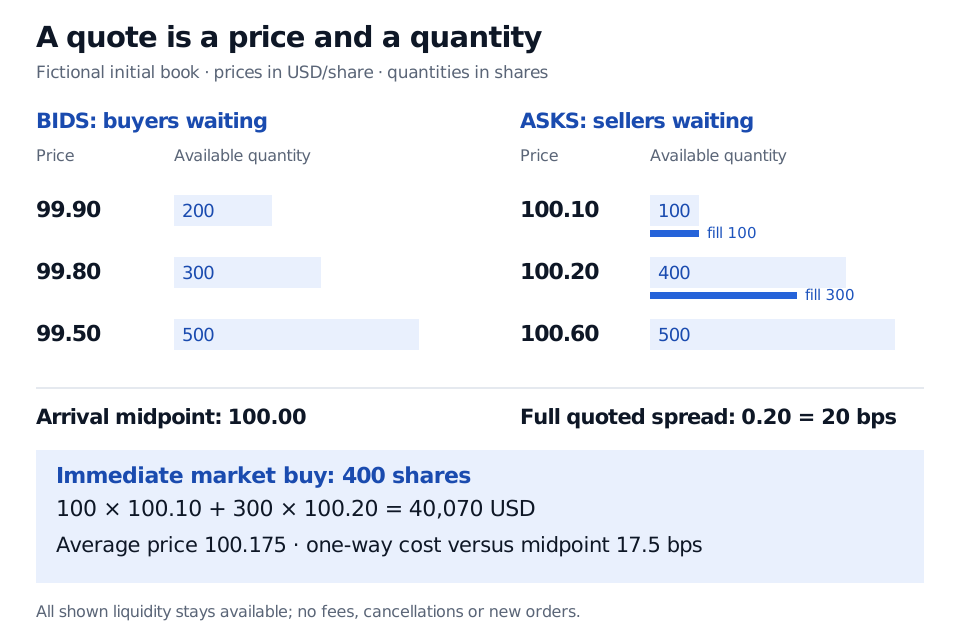
The best bid is 99.90 and the best ask is 100.10. Their midpoint is 100.00. The full quoted bid–ask spread is 0.20 USD per share, or 20 basis points of that midpoint. This is the gap between the best buying and selling prices; it does not mean every share can trade at those prices.
Suppose you submit an immediate market buy for 400 shares. Assume every displayed order remains available, with no cancellations, competing orders, new liquidity or fees. You buy the first 100 shares at 100.10, then the next 300 at 100.20:
Total paid=100(100.10)+300(100.20)=40,070 USD.
Your quantity-weighted average price is 40,070/400=100.175 USD per share. Against the arrival midpoint, the buy's one-way execution cost is
100.00100.175−100.00×10,000=17.5 bps.
The original fictional book offers only 100 shares at 100.10. Buying 400 shares also consumes 300 at 100.20, for an average of 100.175 USD and a one-way midpoint-relative cost of 17.5 bps.
Original static teaching book. Prices are USD/share and sizes are shares. All displayed orders stay available; no cancellations, new orders or fees. The highlighted bars identify the quantities bought.
The first 10 bps comes from paying the best ask rather than the midpoint. Another 7.5 bps comes from walking beyond that best ask. Together they cost 70 USD relative to buying 400 shares at the arrival midpoint. This is an accounting comparison with a benchmark, not evidence that a midpoint fill was available.
These are one-way costs, not full effective-spread measures, which use a factor of two under a common convention. Nor does this static example establish how much of a real trade's market impact would persist: it contains no later market evolution or no-trade counterfactual.
Liquidity also has a direction. In a separate experiment starting from the same initial book, a market sell of 400 shares fills 200 at 99.90 and 200 at 99.80. It receives 39,940 USD, averages 99.85, and costs 15 bps relative to the 100.00 arrival midpoint. The bid and ask sides need not offer equal capacity.
Size changes the answer
Now change just one feature: let the best ask offer 400 shares at 100.10, rather than 100. Keep the remaining ask levels and all bids unchanged.
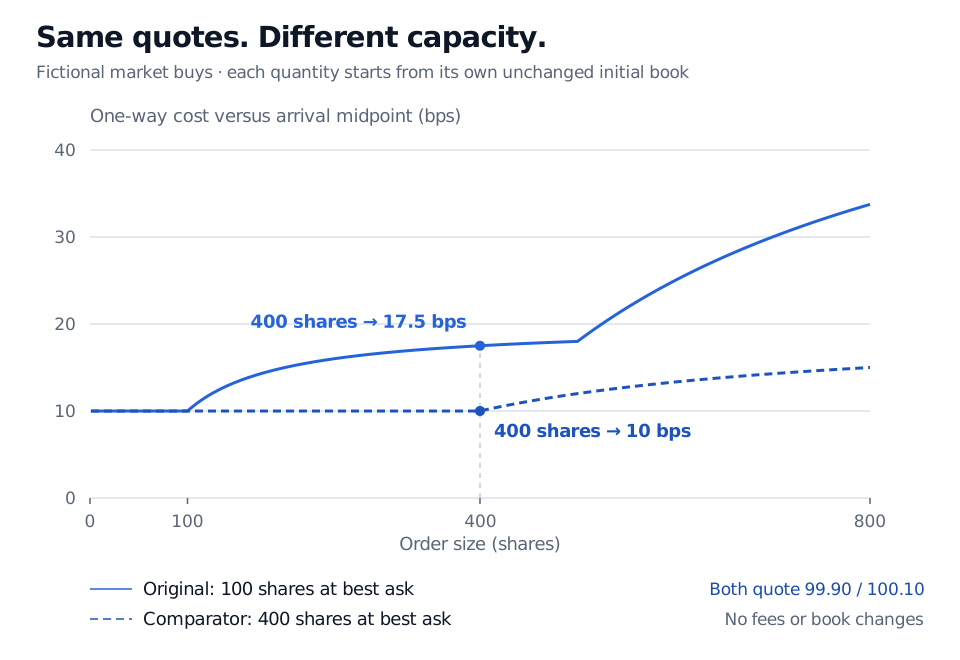
The best prices still read 99.90 / 100.10. The quoted spread is still 20 bps. But the same 400-share buy now fills entirely at 100.10, costing 10 bps versus midpoint. The improvement comes from greater depth at the quoted price.
Identical initial best bid and ask prices conceal different depth. At 400 shares, one-way cost is 17.5 bps in the original book and 10 bps when best-ask quantity is increased to 400 shares.
Original comparison of independent immediate buys from unchanged books. Only best-ask size changes from 100 to 400 shares; the other levels and all bid quotes stay as specified. Each point resets the book. Curves show one-way midpoint-relative cost, excluding fees.
This is why a liquidity assessment needs several dimensions:
Tightness: how costly is crossing the spread for a small immediate trade?
Depth: how much quantity is available near the current price?
Immediacy: how quickly can the intended order execute?
Resilience: how do quotes and available quantities recover after liquidity is consumed or withdrawn?
Our snapshot illustrates tightness and depth. It cannot establish resilience. In a live market, orders can disappear before yours arrives, while new orders or hidden interest can supply more than the screen showed. Displayed depth is conditional availability, not a promise of execution.
To explore the mechanism, use the public Order Book Simulator. Its own scenarios let you predict fills, submit market or limit orders, and compare thin, normal and deep books. It uses smaller books and accepts orders of 1–200 shares, so explore its examples rather than trying to replay this article's 400-share trade.
A limit order adds a price constraint, but waiting does not guarantee a fill. Splitting a large order may reduce the quantity demanded immediately, yet creates exposure to price changes and future liquidity while the rest waits. Speed, price and completion compete with one another.
Market liquidity is different from funding liquidity
Everything above concerns market liquidity: converting an asset into cash, or cash into the asset, through trading. Funding liquidity concerns access to cash or financing to meet obligations and support positions. A desk may hold readily tradable assets yet struggle to refinance them or meet a margin call; this is funding liquidity risk.
The two can reinforce each other under stress. Tighter financing can force sales or reduce dealers' willingness to supply quotes. Poorer market liquidity can then make selling assets to raise cash more costly, worsening the financing strain. Dudley's BIS overview explains this feedback and distinguishes the two meanings.
Neither trading volume nor price volatility alone settles whether a market is liquid. Volume records completed trades, not all the orders that could not trade on acceptable terms. Volatility records price variation; it does not directly tell you the spread or quantity available for your order. For an execution decision, inspect the relevant side of the market, your intended size and deadline, and how those conditions change under stress.
Practice
You need to buy 200 shares from the original book. Assume immediate execution against unchanged displayed asks, no competing orders and no fees. What are the total payment, average price and one-way cost in bps versus the 100.00 arrival midpoint?
Answer. Buy 100 shares at 100.10 and 100 at 100.20. The payment is 100(100.10)+100(100.20)=20,030 USD, giving an average of 100.15 USD per share. The cost is (100.15−100.00)/100.00×10,000=15 bps. Using 100.10 for the whole order would ignore that only 100 shares are available at the best ask.
Rishi K. Narang, Inside the Black Box, 2nd edition, Chapter 5, “Slippage” and “Market Impact,” pp. 81–83: transaction-cost components and the role of time and size. The order books, figures and calculations here are original teaching examples, not market observations.