Start with a question that can fail
Before examining the evaluation period, specify the instrument universe, information cutoffs, entry and exit rules, position sizes, constraints and comparison policy. For the reversal question, an unchanged cash position is a natural initial comparison; a broader investment claim may also require a market-exposure benchmark. “We bought the stocks that subsequently rebounded” does not define an implementable rule.
Cleaning and fitting also have clocks. Estimate a normalisation, imputation rule or model using only the training information allowed at that decision. A feature with a past timestamp can still leak information if its transformation was fitted on future observations.
A four-fill backtest you can reconcile
Freeze this rule: after a close-to-close decline of at least 1%, buy 10 shares in the next session's opening auction, then sell those shares in that session's closing auction. Remain flat otherwise. Do not short or borrow cash.
For these synthetic sessions, the opening auction is at 09:30 and the closing auction at 16:00. The final close becomes usable at 16:01. Compute the signal then, submit the next opening order at 09:25, and submit the predetermined same-session closing order at 15:45, before the assumed auction cutoff. The exit does not depend on knowing that closing price.
The five consecutive closes, from a warm-up session through Session 3, are USD 102, 100, 102, 99 and 100. The test starts after Session 0 closes; the preceding warm-up close supplies its signal. Thus the declines into Sessions 0 and 2 trigger entries in Sessions 1 and 3; the rise into Session 1 does not trigger an entry in Session 2. Stipulate sufficient auction liquidity and full fills at the following prices. These are assumed execution prices, not the best prices selected from each day's range.
| Event | Filled shares | Price per share (USD) | Fee (USD) | Cash after fill (USD) | Shares after fill |
|---|---|---|---|---|---|
| Initial state | — | — | — | 2,000 | 0 |
| Session 1 open: buy | +10 | 100 | 1 | 999 | 10 |
| Session 1 close: sell | −10 | 102 | 1 | 2,018 | 0 |
| Session 3 open: buy | +10 | 101 | 1 | 1,007 | 10 |
| Session 3 close: sell | −10 | 100 | 1 | 2,006 | 0 |
With signed filled quantity (positive for buys), fill price and explicit fee , update
Here is the actual holding in shares and is cash in USD. A signal is a forecast; a target is a desired position; an order requests a trade; a fill creates the actual holding. Only filled quantities belong in this ledger.
The two completed trades earn gross profits of USD 20 and minus USD 10. Therefore
The denominator is the initial account equity, including unused cash. This is the return over the illustrated test window, not an annualised return. There is no remaining inventory to value or liquidate.
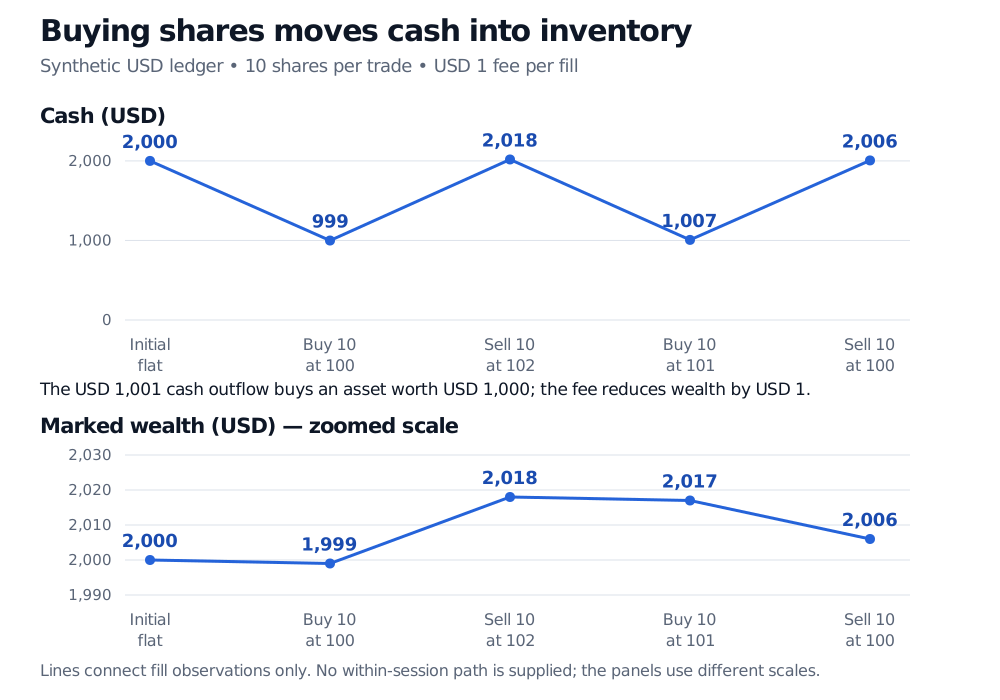
The first buy spends USD 1,001 but acquires shares worth USD 1,000 at that mark. The immediate wealth loss is the USD 1 fee, not the cash spent. While inventory remains open, report marked wealth using a declared mark . A mark is a valuation convention; it does not guarantee liquidation at that price.
Costs can change the trade, not just the answer
Holding these four fills fixed, fees of USD 2 per fill leave only USD 2 net profit; USD 2.50 per fill eliminates the gross USD 10 profit. That is a useful sensitivity calculation, but a larger live order can also receive worse prices, partial fills or no fill. Cash, margin and borrow constraints can change subsequent positions. Rerun the economic simulation when those states change.
Recorded daily highs and lows do not establish that an order could execute at those prices. Chan's discussion of historical data and execution in Chapter 3 makes this distinction explicit. Our auction fills remain assumptions to investigate with suitable data, rather than fills proved by the close series.
Evaluate in the order information arrives
Develop the rule and fit its parameters on earlier data. Use a later validation segment for declared selection decisions. Reserve a later test segment for evaluation of the frozen research procedure. In a walk-forward design, each refit must finish before the next evaluation window begins, using only outcomes already available then.
Chronology alone is insufficient when training outcomes extend into evaluation dates. For example, a future multi-day return used as a training label may overlap the test window. Remove the overlapping training information and apply a gap where the information structure requires it; merely sorting rows by date does not remove leakage.
A backtest can reject a broken implementation or weaken an economic hypothesis. A promising result supports a bounded next step, such as prospective paper trading with explicit limits. It does not turn assumptions about future markets and execution into facts.
Continue with the full ledger and evaluation
Sources
- Ernest P. Chan, Quantitative Trading: How to Build Your Own Algorithmic Trading Business (Wiley, 2009), Chapter 3, especially the opening discussion of replication and the historical-data/execution discussion on pp. 42–43. Local grounding text inspected; the ledger and rule here are original synthetic examples.
- David H. Bailey, Jonathan M. Borwein, Marcos López de Prado and Qiji Jim Zhu, The Probability of Backtest Overfitting, author-hosted revision dated February 2015, introduction and §§2.1–2.2. Supports the distinction between strategy selection and reporting one favourable simulation.