Maximum drawdown measures the deepest peak-to-later-trough loss in a wealth path. Calculate it, date the recovery and see why return order and sampling matter.
Maximum drawdown
Maximum drawdown (MDD) is the largest percentage loss from an earlier peak to a later trough in a specified wealth record. It answers a practical question: how far below its previous best value did the investment fall before the record ended? A strategy can finish profitably and still suffer a loss large enough to trigger redemptions, margin pressure or a reduction in capital along the way.
The percentage convention matters. This article reports MDD as a positive loss magnitude, such as 33.33%. The underlying signed drawdown is negative below a peak, so the corresponding worst signed drawdown is −33.33%. Some reports call that negative number “maximum drawdown”; check the convention before comparing them.
Keep the peak behind the trough
For positive total-return wealth observations W0,…,WT, define the running peak and signed drawdown by
Ht=0≤s≤tmaxWs,dt=HtWt−1.
The running peak includes the current observation, so dt≤0 and a new high has zero drawdown. The positive MDD is
MDD=−0≤t≤Tmindt=0≤s≤t≤Tmax(1−WsWt).
The order restriction s≤t is essential. Taking the largest and smallest values anywhere in the record can pair a low with a peak that had not happened yet. Drawdown measures a loss that could actually have been experienced in chronological order.
This is a relative loss. The associated peak-to-trough difference Ht−Wt is an absolute loss in currency units or index points; it is a different measurement. Magdon-Ismail and coauthors’ original mathematical treatment defines the running-maximum loss in absolute units for a stochastic process. Dividing a positive wealth loss by its own preceding peak gives the percentage convention used here.
A profitable finish after a one-third loss
Imagine a hypothetical investment measured at six monthly closes. Its total-return wealth index starts at 100, includes investment income, and has no external deposits or withdrawals. These are synthetic values, not a fund track record.
Observation date
Wealth index Wt
Running peak Ht
Signed drawdown dt
31 Jan 2025
100
100
0%
28 Feb 2025
120
120
0%
31 Mar 2025
90
120
−25%
30 Apr 2025
108
120
−10%
31 May 2025
80
120
−33.33%
30 Jun 2025
124
124
0%
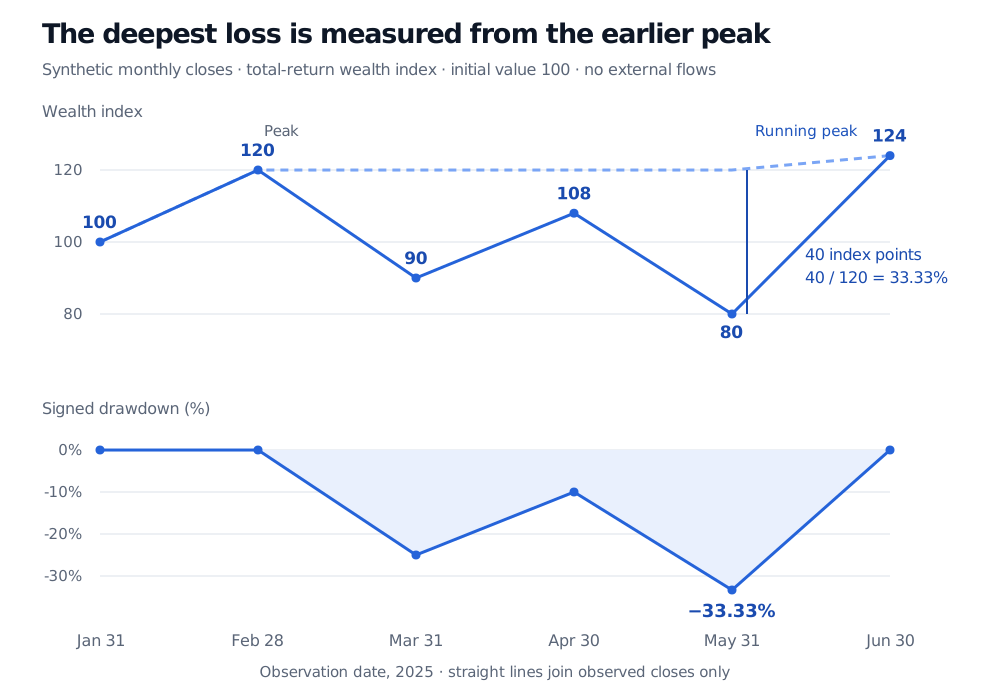
The maximum drawdown is the fall from 120 on 28 February to 80 on 31 May:
MDD=120120−80=31≈33.33%.
The April rebound does not reset the reference peak: 108 is still below 120. June's 124 establishes a new high and closes that drawdown episode. The whole record returns 124/100−1=24%, but an investor holding through it first endured a one-third loss from the February high.
Synthetic monthly wealth and its running peak, with signed drawdowns of 0%, 0%, −25%, −10%, −33.33% and 0%. February's 120 is the peak, May's 80 the trough, and June's 124 the first observed recovery.
Original synthetic total-return wealth index, base 100, with no external flows. The dashed line is the running peak. Straight lines connect monthly observations; intramonth movements are unknown.
Notice that the record's global maximum is 124, which occurs after the trough. Calculating (124−80)/124≈35.48% would use the wrong chronology. It is not this record's MDD.
Recovery changes the denominator
From 80, returning to the old peak of 120 requires a 50% gain:
80120−1=50%.
The loss percentage used 120 as its base; the recovery gain uses 80. More generally, after a fractional loss L with 0≤L<1, the gain needed to regain the peak is
g=1−L1−1=1−LL.
Report the dates alongside the depth. Here the peak-to-trough decline spans three monthly intervals; trough-to-first-observed-recovery spans one; peak-to-recovery spans four. Recovery means the first observed value at or above the previous peak. With repeated equal peaks or tied deepest troughs, state which dates you select. If the record ends below the peak, recovery is unfinished: give the elapsed duration as “at least”, rather than assigning a completed recovery time. Monthly observations also cannot reveal the exact intramonth recovery date.
The order of returns changes the result
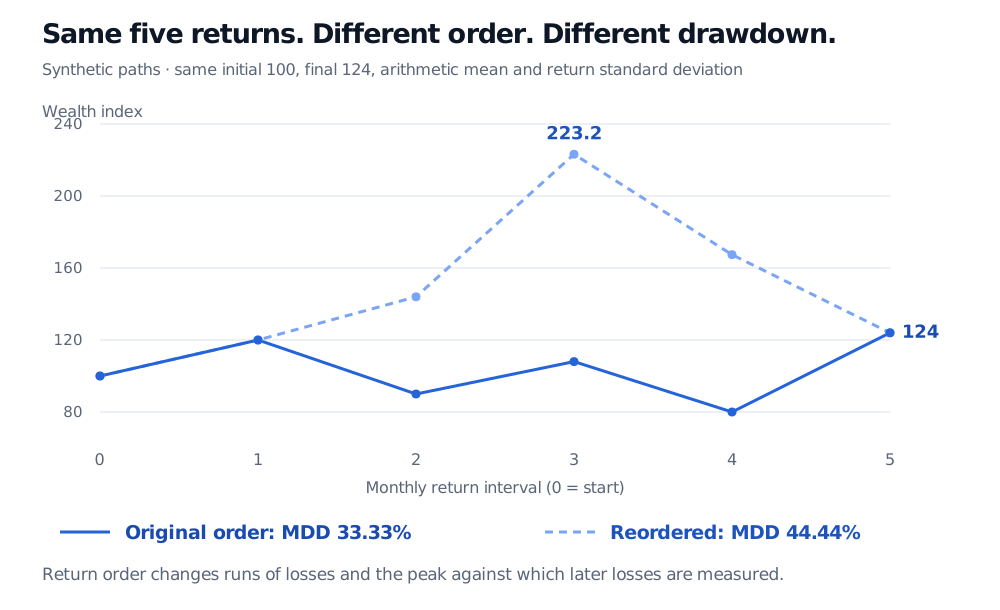
The example's five successive returns are approximately +20%, −25%, +20%, −25.93%, +55%. Now rearrange the exact same returns to put the three gains first and the two losses last. Wealth becomes
100,120,144,223.2,167.4,124.
The new MDD is
1−223.2124=94≈44.44%.
Two synthetic paths use exactly the same five returns in different orders. The original has MDD 33.33%; the reordered path reaches 223.2 before falling to 124, giving MDD 44.44%. Both finish at 124.
Only return order changes. The reordered path's final drawdown is still open at the end of the record.
Both paths have the same total return, arithmetic mean and sample standard deviation of monthly returns. Their loss sequences and drawdowns differ. This isolates path dependence: an endpoint and a return-distribution summary do not determine the losses endured on the way. It does not establish that either strategy has the same future risk, or that rearranging historical returns creates a realistic alternative market history. With a constant matched cash return, the sample Sharpe ratio would also be unchanged by this permutation; the timing of losses would still differ.
What belongs beside an MDD number
The measurement window and starting peak. “Maximum drawdown: 12%” is incomplete without dates. Extending the end date of a fixed record cannot reduce its historical maximum; it adds possible peak–trough pairs. Moving a rolling window can remove the worst episode. A calculation that resets the peak at the window's start also differs from one that carries in a high reached before it. Neither should be compared with an inception-to-date figure without explanation. MDD has no general square-root-of-time annualisation rule.
Observation frequency and valuation quality. Month-end marks can miss a severe fall and rebound inside the month. If a finer observation grid contains every coarse observation, uses the same wealth values at shared times, and covers the same horizon, its measured MDD cannot be smaller: all coarse peak–trough pairs remain available. This is a property of nested observations, not permission to compare unrelated data sets. Stale or smoothed valuations can also conceal losses and shift their apparent timing. Close-only MDD does not measure every intraday exposure or executable liquidation loss. Goldberg and Mahmoud discuss observation frequency as a material parameter in drawdown analysis.
A return series adjusted for external flows. A withdrawal reduces an account balance without necessarily representing an investment loss; a subscription can lift the balance without earning a recovery. For strategy performance, chain subperiod total returns into a unitised wealth index, splitting periods at external flows where possible. Specify fees, financing, income, currency and valuation rules consistently. An investor may separately care about actual account wealth, but label that object clearly. The positive-wealth percentage definition above should not be applied mechanically to a zero or negative net-equity series.
A historical observation, not a promised limit. MDD is the worst realised drawdown in the chosen sample. It is neither a probability estimate nor a guarantee that a future loss will stop there. A new regime, leverage change, illiquid exit or previously unseen gap can produce a deeper fall. A stop-loss threshold is a trading rule with execution and funding assumptions; it does not turn historical MDD into an insured floor. Paleologo's Chapter 9 examines the costs of reducing exposure during losses, including trading costs and missed participation in a recovery.
For a broader performance report, read Backtest Evaluation. Its full lesson requires membership, with a public preview. It connects flow-adjusted returns and drawdown duration to costs, exposure and uncertainty in a backtest.
Sources
Giuseppe A. Paleologo, Advanced Portfolio Management: A Quant’s Guide for Fundamental Investors (2021), §§9.1–9.2, pp. 149–154 — high-watermark loss baselines and the practical costs of stop-loss policies. All paths, dates and numerical comparisons here are original synthetic examples.