Measure slippage with a clear benchmark and buy/sell sign, reconcile a 1,000-share execution, and see why zero limit-price slippage can hide an unfinished order.
Slippage
Slippage is the difference between an execution price and a stated reference price. It measures how the price actually obtained compares with the price used to judge the trade. For a buy, paying more is adverse; for a sell, receiving less is adverse. A fill can also be better than its reference, producing favorable slippage.
The reference is part of the definition. “The trade slipped by five basis points” is incomplete without the side, benchmark, timestamp and quantity. A difference from the decision-time midpoint answers a different question from a difference from the best ask when a buy reaches the market.
For orientation, the bid–ask spread separates the best buying and selling quotes; the order book shows the available displayed quantities at successive prices. Both matter when a trading signal becomes an actual position.
Choose the sign before doing the arithmetic
Use a positive-is-adverse-cost convention. Let s=+1 for a buy and s=−1 for a sell. For executed quantity q>0, average fill price Pˉ and reference price B:
CB=sq(Pˉ−B),cBbps=104sBPˉ−B,B>0.
The dollar measure has units of currency; the second divides it by the reference notional qB. With several fills, calculate their quantity-weighted average:
Pˉ=∑iqi∑iqiPi.
This is the VWAP of your fills, not necessarily the market's VWAP over an interval. If nothing fills, the average fill price and filled-share slippage are undefined. Reporting zero would make an unsuccessful order look like perfect execution.
For 100 shares against a USD 100 reference, buying at 99.98 gives USD −2 of cost, while selling at 99.98 gives USD +2. Selling at 100.02 gives USD −2. Some reports reverse the sign to make positive mean favorable performance. Read that convention before comparing numbers.
A USD 64 difference can also be a USD 24 difference
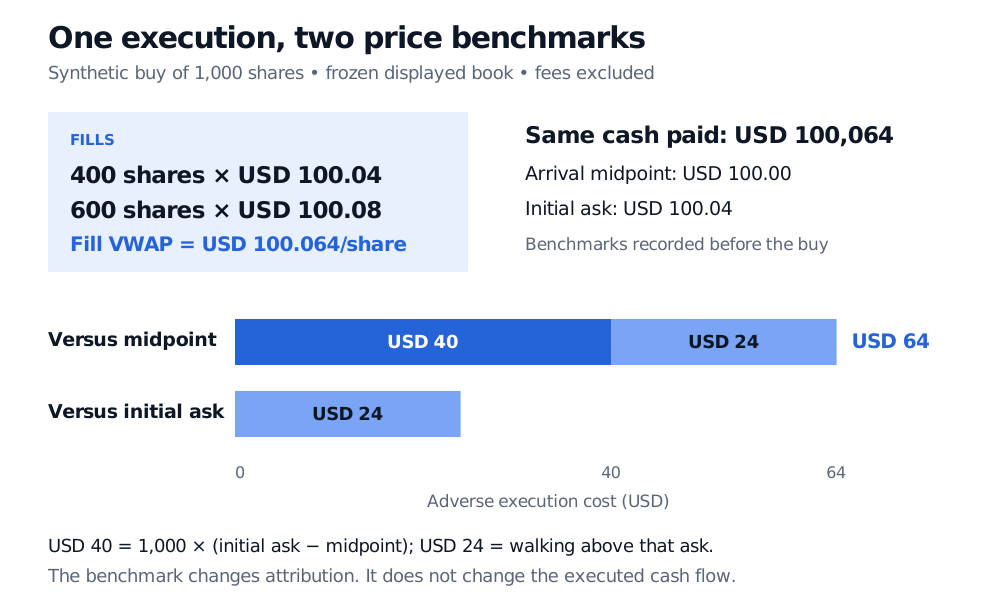
A portfolio manager sends a buy for 1,000 shares. At arrival, the midpoint is USD 100.00 and the best ask is USD 100.04. In a synthetic frozen-book example, the order consumes:
Fill
Shares
Price, USD/share
Cash paid, USD
First displayed level
400
100.04
40,016
Next displayed level
600
100.08
60,048
Total
1,000
—
100,064
The resulting fill VWAP is USD 100.064 per share. That third decimal is legitimate for an average, even though both individual fills occur at whole-cent prices.
Against the arrival midpoint, adverse slippage is:
1,000(100.064−100)=64USD,1041000.064=6.4bps.
Against the initial ask, the difference is only 1,000(100.064−100.04)=24 USD. The remaining USD 40 in the midpoint comparison is the cost of crossing from the midpoint to that initial ask across all 1,000 shares. These are alternative benchmark views of the same cash payment. Do not add USD 24 to USD 64.
One synthetic buy has fill VWAP USD 100.064: adverse cost is USD 64 versus arrival midpoint 100, comprising USD 40 to the initial ask and USD 24 above it. Versus initial ask 100.04, cost is USD 24.
Original frozen-book example. Costs are in USD; no cancellation, competing order, new liquidity or price movement is assumed during matching. Fees are excluded.
Suppose a separate commission is USD 5. Execution-price slippage remains USD 64 versus the midpoint; all-in cost versus that midpoint is USD 69, or 6.9 bps of the USD 100,000 reference notional. Broader transaction cost includes such explicit charges. If a provider uses “slippage” for an all-in measure, its fee treatment must be stated.
The cash ledger already pays USD 100,064 for the shares. Deduct the commission separately; do not subtract another USD 64 from that ledger. The benchmark gap explains cash already spent.
A benchmark is a question, not just a price
Reference
What the comparison asks
What it can obscure
Decision-time price
What happened after the investment decision?
Later execution alone cannot identify which moves the order caused.
Arrival midpoint
What did execution cost relative to the market when the order arrived?
Any decision-to-arrival delay is excluded.
Initial ask for a buy, bid for a sell
How far did fills depart from the executable touch for a small order?
The spread cost relative to midpoint is excluded.
Market VWAP over a specified window
How did the fills compare with the market's volume-weighted trading prices?
A large order can itself affect that benchmark.
Order's limit price
Were fills better than the permitted worst price?
An acceptable price says nothing about completion or missed opportunity.
Record the exact clock event behind “arrival”: receipt by the broker and receipt by the venue need not occur simultaneously. A stale last-traded price is also different from a currently available quote. The SEC's execution explanation describes why routing takes time and quotes apply to limited quantities.
None of these comparisons alone proves causal market impact. The price might move because of your trading, other participants, news or changing liquidity. Slippage is an observed benchmark difference; separating its causes requires additional evidence or a model.
The unfilled shares still matter
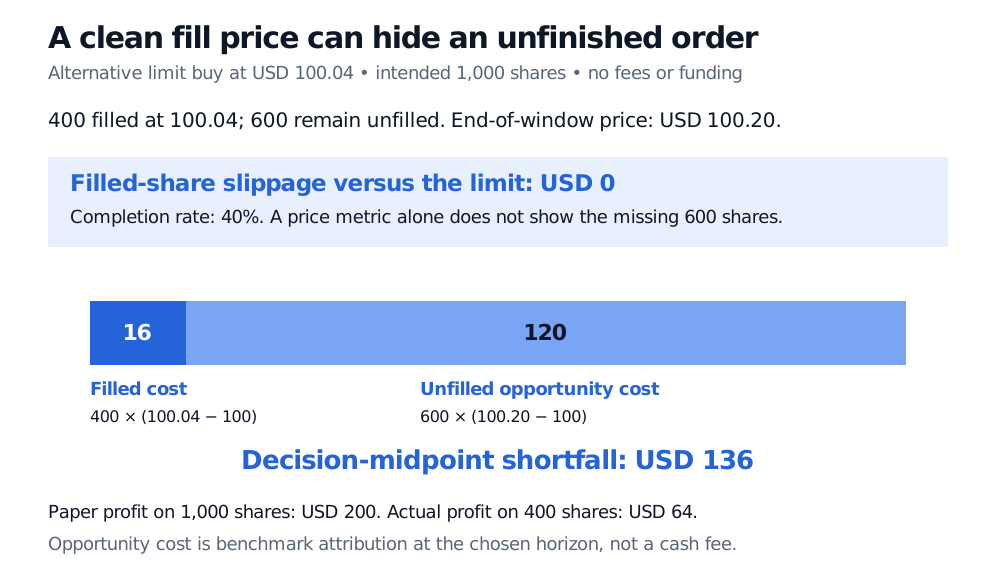
Change the order to a buy limit of USD 100.04 in the same frozen book. Assume 400 shares fill at the limit and 600 remain unfilled through the chosen evaluation window. Slippage relative to the limit is zero on the fills. Completion is only 40%.
Now stipulate that the end-of-window price is USD 100.20 and the decision midpoint was USD 100.00. Ignore funding, distributions and fees. The paper portfolio that bought all 1,000 shares at the decision price earns USD 200; the actual 400-share position has marked profit of USD 64. The difference is USD 136:
An alternative limit buy fills 400 shares at 100.04 and leaves 600 unfilled. At end price 100.20, decision-midpoint shortfall is USD 136: USD 16 on fills plus USD 120 of unfilled opportunity cost, despite zero slippage versus the limit.
Original alternative-order comparison. Opportunity cost uses the stated USD 100 decision benchmark and USD 100.20 terminal mark; it is attribution of foregone performance, not a cash fee.
This is the wider implementation-shortfall perspective: compare actual results with an explicitly defined paper trade, including the part never completed. If the end price instead falls, the unfilled quantity can have a favorable opportunity contribution. The evaluation horizon affects the result.
A limit constrains execution prices; it does not guarantee execution. Even a trade printed at the limit does not prove your order filled: queue priority and available opposing quantity matter. A market order prioritizes execution at available prices, but it cannot promise the displayed price or a complete fill under every market condition. The SEC's order-type bulletin explains the price-versus-execution trade-off.
Use slippage to improve the next simulation
For backtesting, estimate costs using information available when the order could have arrived. Preserve decision, arrival and fill times; retain partial fills and cancellations; state whether fees sit inside or outside the reported measure. Compare cost across order sizes and liquidity conditions rather than assuming one constant deduction fits every trade.
Higher volatility can increase uncertainty over delayed execution. It does not mechanically make every fill worse: the benchmark can move favorably, and book depth can create slippage even without any intervening price movement. Urgency, size, depth, latency and execution policy interact.
The public Order Book simulator lets you explore market versus limit orders and changing displayed depth. Its slippage display uses the pre-trade touch, while its execution review uses a separate starting-midpoint objective. The session accepts 1–200 shares and omits fees and margin. Use it to explore the mechanism; the 1,000-share book above is a separate teaching example.
For a fuller treatment, Order Books develops depth, partial coverage and queue uncertainty. Financing, Borrow and Transaction Costs extends the cash ledger and explains why fill slippage must not be charged twice. Both links provide public previews; full lessons require membership.
Sources
Narang, R. K. (2013). Inside the Black Box, 2nd ed., Chapter 5, “Defining Transaction Costs,” especially “Slippage” and “Market Impact,” pp. 80–84. Narang uses slippage more narrowly for decision-to-market delay; this article explicitly uses execution price versus a named benchmark and keeps causal attribution separate.