A yield curve plots yields against maturity on one date. See how par, zero and forward curves differ, what upward, flat, inverted and humped shapes can mean, and why 2s10s is only one slice.
Yield curve
A yield curve plots yields against maturity for debt of one issuer type and credit quality, in one currency, on one date. Each point answers a single question: what annual rate does this maturity pay today? The line through the points shows how that rate changes as the horizon lengthens.
"The yield curve" is shorthand, and the shorthand hides a choice. The same bond prices can be quoted as par yields, as zero (spot) rates or as forward rates, and each gives a different curve. A headline about the 10-year yield is usually the yield to maturity of a recently issued bond, which sits close to the par yield, and the daily curve the US Treasury publishes is a par yield curve. Pricing models usually work with zero rates or discount factors. This page keeps the three apart and says which one it means.
Conventions throughout: annual compounding, government credit, one currency, and a fictional curve. Nothing below is market data.
One set of prices, three curves
Suppose a rates analyst is handed these zero rates for a fictional government. A zero rate zn is the annual rate on a single payment at year n, so the discount factor for that payment is dn=(1+zn)−n. From the discount factors, two other curves follow.
The par yieldcn is the coupon rate at which an n-year bond with annual coupons is worth exactly its face value. Hull’s condition for the par yield c is 100=Ac/m+100d, where d is the discount factor at maturity, A is the value of an annuity paying one unit on each coupon date and m is the number of coupons a year. With annual coupons (m=1) and a face value of 1:
cn(d1+⋯+dn)+dn=1⟹cn=d1+⋯+dn1−dn.
The one-year forward rate for year n is the rate that, applied to year n alone, links the (n−1)-year and n-year zero rates:
fn−1,n=(1+zn−1)n−1(1+zn)n−1.
Maturity
Zero rate zn
Discount factor dn
Par yield cn
Forward rate for year n
1 year
3.50%
0.966184
3.5000%
3.5000%
2 years
4.00%
0.924556
3.9902%
4.5024%
3 years
4.40%
0.878817
4.3755%
5.2046%
The 3-year par yield, step by step, is (1−0.878817)/(0.966184+0.924556+0.878817)=0.121183/2.769557=4.3755%. The year-3 forward rate is 1.0443/1.042−1=5.2046%.
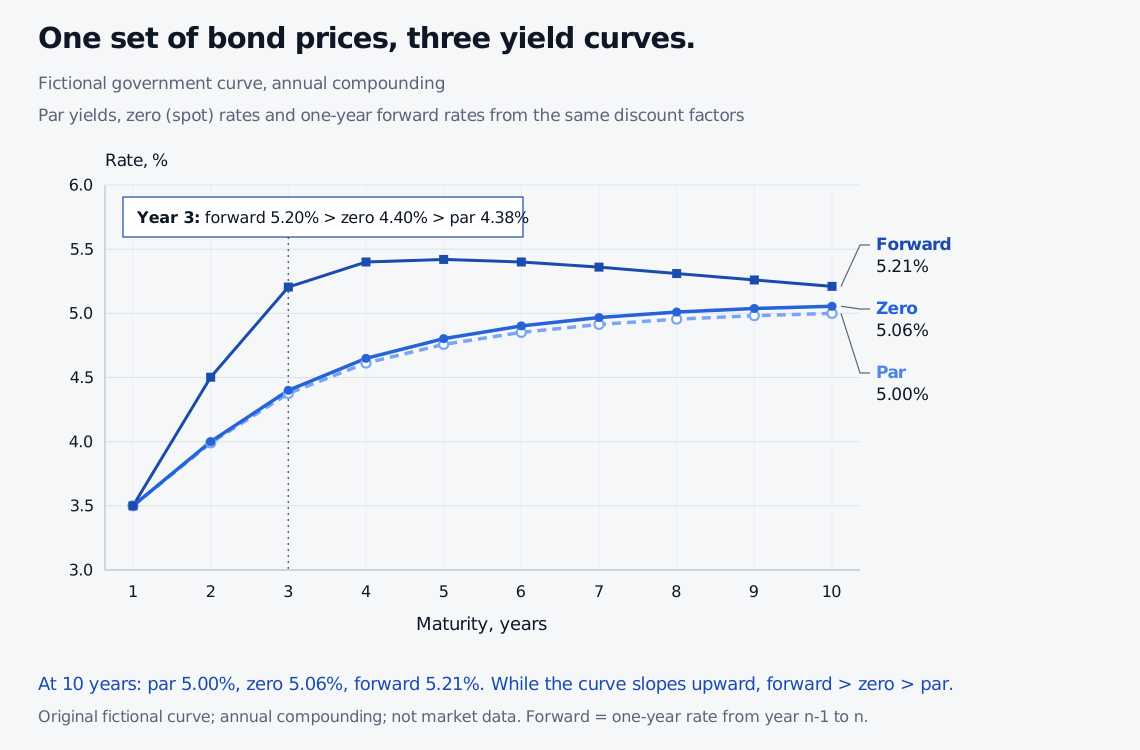
One set of prices therefore gives a 3-year zero rate of 4.40%, a 3-year par yield of 4.3755% and a forward rate for year 3 of 5.2046%. The curves are linked. A zero rate is an average of the forwards up to its maturity: 1.035×1.045024×1.052046=1.137893=1.0443. A par yield is a coupon-weighted blend that leans on the earlier, lower zero rates. While the curve rises, forward lies above zero and zero lies above par. On a curve that falls throughout, the order reverses.
Line chart of par, zero and one-year forward curves for maturities of 1 to 10 years, all built from one fictional set of discount factors with annual compounding. At 3 years the par yield is 4.3755 percent, the zero rate is 4.40 percent and the forward rate for year 3 is 5.2046 percent. At 10 years the par yield is 4.9997 percent and the zero rate is about 5.06 percent. The forward rate peaks at 5.42 percent for year 5 and eases to 5.21 percent for year 10. While the curve rises, forward lies above zero and zero lies above par.
Original fictional illustration. One set of discount factors, annual compounding, government credit, one currency. The three lines are different ways of quoting the same prices, not three markets.
Why one yield cannot replace the curve
Take a 3-year bond with face value 100 and a 5% annual coupon. Price it off the curve, discounting each payment with its own factor:
5(0.966184)+5(0.924556)+105(0.878817)=101.7295.
The yield to maturity of that price is 4.3724%. It is below the 3-year par yield of 4.3755% and below the 3-year zero rate of 4.40%. None of the three is wrong. All are fairly priced quotes of the same curve, and they differ because the cash-flow structures differ. Tuckman calls this the coupon effect: fairly priced bonds of the same maturity have different yields to maturity depending on their cash flows, so a higher yield alone does not make one a better investment.
The single yield also misprices the pieces of the bond. Discount a payment of 100 due in one year at the bond's 4.3724% and you get 95.81. The curve says 96.62, so the single yield is 0.81 too low. Discount a 3-year zero-coupon payment of 100 the same way and you get 87.95 against the curve's 87.88. By construction the errors offset inside the bond's own price. That is why its YTM works for the bond and fails for any payment pattern that differs from it.
That is why quantitative work prices with the curve. Every cash flow is discounted at the rate for its own maturity: PV=∑kCkdk. The same curve prices bonds and swaps, supplies the forward rates the market implies, and underlies risk measures such as duration that ask how value moves when different maturities shift by different amounts.
Shapes and what the slope can mean
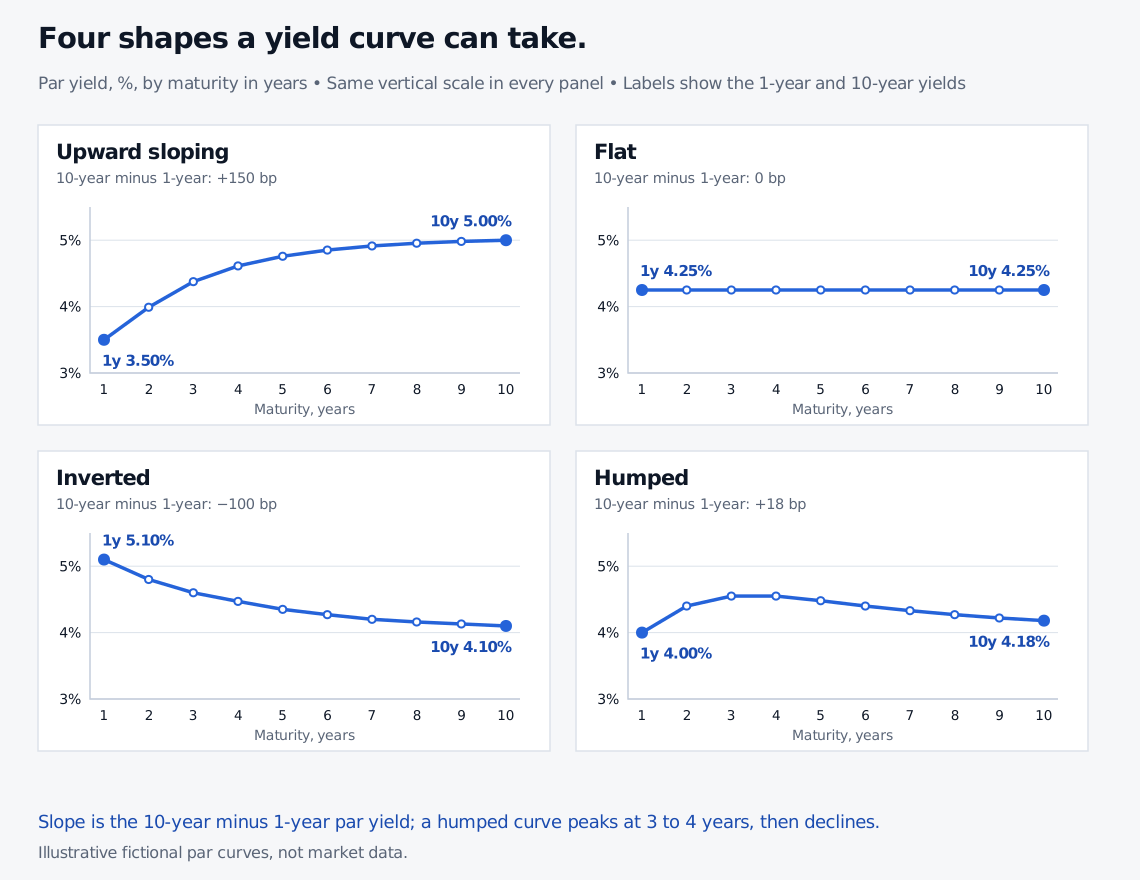
Four shapes are named in everyday use, shown below for par yields.
Four fictional par-yield curves for maturities of 1 to 10 years. The upward curve rises from 3.50 percent at 1 year to 4.9997 percent at 10 years. The flat curve is 4.25 percent at every maturity. The inverted curve falls from 5.10 percent at 1 year to 4.10 percent at 10 years. The humped curve rises from 4.00 percent at 1 year to a peak of 4.55 percent around 3 to 4 years and eases to 4.18 percent at 10 years.
Original fictional illustration. Four par-yield shapes on the same axes. The values are chosen to show each shape and are not market data or forecasts.
Upward-sloping (normal): longer maturities yield more. Hull notes that curves tend to slope upward more often than downward. "Normal" refers to that frequency, not to a rule.
Flat: yields are about equal across maturities.
Inverted: shorter maturities yield more than longer ones. See inverted yield curve.
Humped: yields rise, peak at a middle maturity and then ease.
Why does the slope have the shape it has? Hull’s section on the term structure sets out three theories. He calls liquidity preference the most appealing, but none is settled.
Expectations theory: the forward rate for a future period equals the expected future zero rate for that period. A rising curve then signals that the market expects short rates to rise. See expectations hypothesis.
Liquidity preference theory: investors prefer to lend short and borrowers prefer to borrow long at fixed rates, so forward rates exceed expected future zero rates. A term premium is built into the slope. Hull notes this is consistent with curves sloping upward more often than downward.
Market segmentation theory: each maturity range has its own supply and demand, and there need be no link between short, medium and long rates.
The expected short-rate path and any premium are not separately observable. A given curve can fit more than one story, and any split of its slope is model-dependent. The 5.20% forward rate for year 3 in our fictional curve says the market prices year-3 money well above today's 3.50%. It does not say whether that reflects expected higher short rates, a premium for holding longer bonds, or both.
The 2s10s spread
The most-watched single number is the 2s10s spread: the 10-year yield minus the 2-year yield, quoted in basis points. Positive means the curve is upward-sloping between those two points, negative means inverted. It is a description of one date's curve, and this page makes no claim about what it forecasts.
It is also one slice, and it depends on which curve you use:
Curve
2-year
10-year
2s10s
Upward par curve
3.9902%
4.9997%
+101 bp
Upward zero curve (same prices)
4.00%
5.0551%
+106 bp
Flat
4.25%
4.25%
0 bp
Inverted
4.80%
4.10%
−70 bp
Humped
4.40%
4.18%
−22 bp
The humped curve makes the point. Its par yield climbs from 4.00% at one year to 4.55% by year three, yet its 2s10s is negative because it has eased back by year ten. A sign flip in 2s10s tells you the 2-year and 10-year points have swapped order, not that the whole curve has.
Reading a real curve
The US Treasury publishes the Daily Treasury Par Yield Curve Rates, with yields from 1 month to 30 years. Per the Treasury's methodology page, the official curve is a par yield curve derived with a monotone convex method. Its inputs are indicative, bid-side quotations for the most recently auctioned bills, notes and bonds.
Two consequences follow. A 10-year figure on that page is a par yield, not a 10-year zero rate, so it sits where the table above puts par yields. And the points between input securities are interpolated, not observed. For a zero or forward curve you need to build it, using the steps above or a fitted model.
A government curve is also not the only curve. Corporate bonds add a credit spread over it, and the risk-free rate page explains why Treasury yields are one proxy among several for the base curve.
Where to go next
SelfMadeQuant's Fixed Income and Interest Rate Models Programme has three lessons that extend this page. Each has a public preview; the full lessons require membership.
John C. Hull, Options, Futures, and Other Derivatives, 9th ed., Global Edition, Chapter 4: Section 4.3 on zero rates, Section 4.4 on bond yield and par yield, Section 4.6 on forward rates, Section 4.10 on expectations, market segmentation and liquidity preference theories.
Bruce Tuckman, Fixed Income Securities: Tools for Today’s Markets, 2nd ed., Chapters 1-2 on discount factors, spot and forward rates, and Chapter 3 on yield to maturity and the coupon effect.