A credit spread is the extra yield a risky bond pays over a benchmark of the same currency and maturity. See how G-, I- and Z-spreads differ, what the spread contains and what it says about default.
Credit spread
A credit spread is the extra yield a bond with credit risk offers over a benchmark of the same currency and maturity, usually government bonds or swaps. It is quoted in basis points and pays for more than the chance of default: expected default loss, a premium for bearing default risk that cannot be diversified away, and differences in liquidity, tax treatment and benchmark. Fabozzi's definition compares bonds that are "identical in all respects except for quality". Real bonds also differ in embedded options, so a quoted spread is only as clean as the measure behind it.
"Credit spread" is a family of measures: the G-spread, I-spread, Z-spread, option-adjusted spread and the spread on a credit default swap. They agree only in simple cases, so name the measure whenever you quote one.
Conventions throughout: annual compounding, one currency, and the fictional government zero curve of the yield curve and spot interest rate pages (1 year 3.50%, 2 years 4.00%, 3 years 4.40%). Nothing is market data.
One bond, two spreads
Mira, a credit analyst, is shown a fictional 3-year corporate bond: face 100, 6% annual coupon, price 100.3570. Her first question is "over what?" The bond's yield to maturity is 5.8668%. Two benchmarks give two spreads.
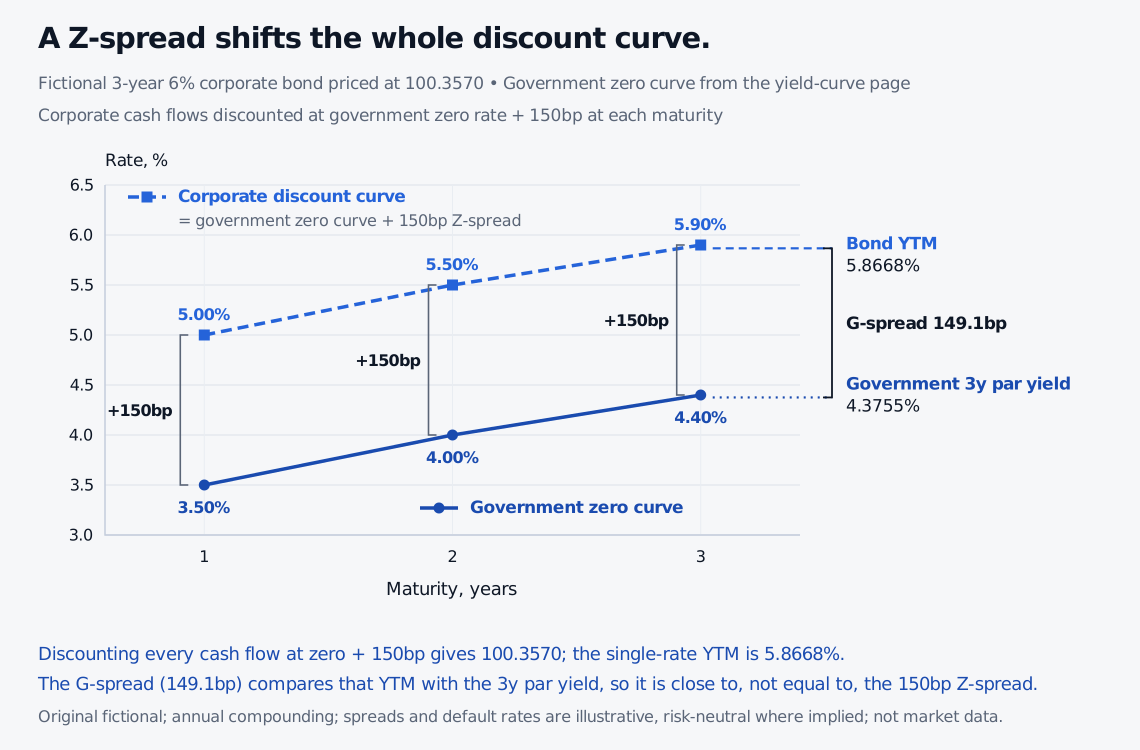
G-spread (government spread): the bond's yield minus the government yield at the same maturity, interpolated if no bond matures on that date. The 3-year government par yield is 4.3755%, so the G-spread is 5.8668%−4.3755%=149.1 bp.
Z-spread (zero-volatility or static spread): the constant Z added to every government zero rate zk so that the discounted cash flows Ck equal the price:
P=k=1∑n(1+zk+Z)kCk.
Trying Z=150 bp reprices Mira's bond exactly:
1.056+1.05526+1.0593106=100.3570.
The same cash flows discounted on the government curve alone are worth 104.4991, so the credit-risky price is 4.1420 lower. The Z-spread restates that price gap as a yield-like number.
Chart of annually compounded rates for years 1 to 3. The fictional government zero curve is 3.50, 4.00 and 4.40 percent. The corporate discount curve is the same curve shifted up by 150 basis points: 5.00, 5.50 and 5.90 percent. Discounting a 3-year 6 percent coupon bond at the shifted curve gives its price of 100.3570. Two reference levels are marked: the bond's yield to maturity of 5.8668 percent and the 3-year government par yield of 4.3755 percent. Their gap is the G-spread of 149.1 basis points, close to but not equal to the Z-spread of 150 basis points.
Original fictional illustration. Annual compounding, one currency, fictional government zero curve. The G-spread compares two single yields; the Z-spread shifts the whole curve. Not market data.
Here the two measures sit within a basis point of each other. Subtracting the 3-year zero rate of 4.40% instead would give 146.7 bp, which is why the benchmark must be named. The G-spread compares one yield with one yield and inherits the coupon effect from the yield curve page. The Z-spread discounts each payment at its own maturity's rate. Fabozzi notes that the two differ little for short bullet bonds, and more as the curve steepens or when cash flows are not a bullet, as with sinking funds and mortgage securities.
Other benchmarks, and options
I-spread: the bond's yield minus the interpolated swap rate of the same maturity. Hull observes that the LIBOR/swap curve is often used as the risk-free benchmark in credit work, and that asset swap spreads give a direct estimate of the spread over that curve. LIBOR has since been retired; see the risk-free rate page.
Option-adjusted spread: the Z-spread with the embedded option removed. Fabozzi defines the option value in spread terms as static spread minus OAS. A callable bond's Z-spread includes pay for having sold the issuer a call, so compare callable and bullet bonds on option-adjusted spread. Whether the OAS contains credit compensation depends on whether the model tree was built from the Treasury curve or the issuer's own curve.
CDS spread: the annual premium for insurance against the issuer's default, paying notional times one minus recovery on default. Hull's arbitrage argument says the bond's spread over the risk-free rate should approximately equal the CDS spread. The difference, the CDS-bond basis, tends to be near zero but was positive in some periods and negative in 2007 to 2009. A CDS spread does not depend on the choice of risk-free rate, which a bond spread does.
Benchmark choice matters because Hull notes that bond traders quote spreads over Treasuries while Treasury rates are too low to be useful risk-free proxies. A spread over Treasuries therefore contains some benchmark effect on top of credit.
What the spread contains
Expected loss alone. Take a fictional 1-year corporate zero-coupon bond with face 100. Suppose the real-world default probability is 2%, recovery is 40% of face, and the risk-free 1-year rate is 3.50%. If investors asked only for expected loss, the expected payoff would be 0.98×100+0.02×40=98.80 and the price 98.80/1.035=95.4589. That price implies a yield of 4.7571%, a spread of 125.7 bp. In general, with default probability λ, recovery R and risk-free rate r:
1+y=1−λ(1−R)1+r.
The spread is close to the 1.2% expected loss rate (2%×0.6) but a little above it, because it is earned on the price paid and compounds at the risk-free rate.
Observed spreads on comparable bonds are typically wider. Hull compares the default probabilities implied by spreads (risk-neutral) with those estimated from history (real-world) and finds the first much higher, especially for investment-grade bonds. Liquidity is part of the reason, but he cites research showing it does not fully explain the gap. He gives as by far the most important reason that defaults cluster: default rates are low in some years and high in others, which is systematic risk that investors must be paid to bear. Fabozzi's list of drivers adds tax treatment and embedded options. The spread is therefore not a default forecast.
The credit triangle. Hull's equation (24.2) turns a spread into an average hazard rate, using s≈λˉ(1−R):
λˉ≈1−Rs.
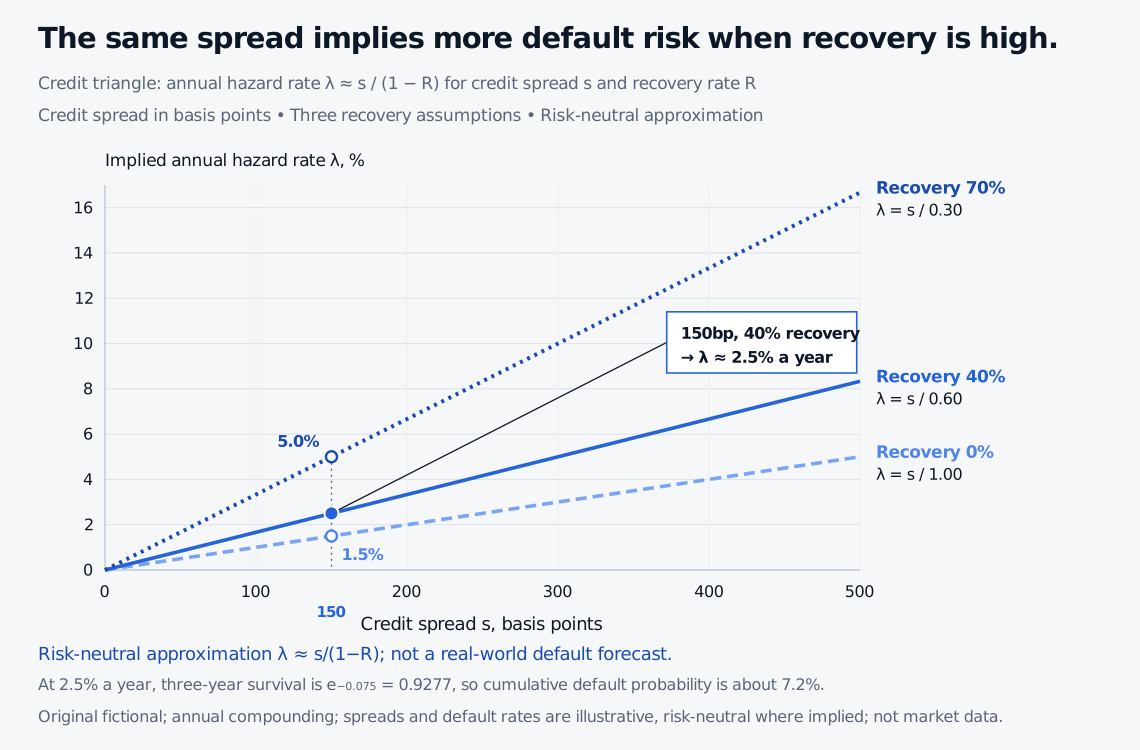
With s=150 bp and R=40%, the average hazard rate is 0.015/0.6=2.5% a year. A constant hazard rate gives a 3-year survival probability of e−0.025×3=92.77%, so the cumulative default probability is 7.23%. That figure is risk-neutral: it is the default probability that reproduces the price, not a forecast. The answer is sensitive to the recovery rate. At the same 150 bp, a 0% recovery gives 1.50% and a 70% recovery gives 5.00%.
Line chart of the implied average annual hazard rate against the credit spread from 0 to 500 basis points, for recovery rates of 0, 40 and 70 percent. Each line is straight and equals the spread divided by one minus the recovery rate. At a 150 basis point spread the hazard rates are 1.50 percent for 0 percent recovery, 2.50 percent for 40 percent recovery and 5.00 percent for 70 percent recovery. The point at 150 basis points and 40 percent recovery is marked at 2.5 percent. At 500 basis points the three lines reach 5.00, 8.33 and 16.67 percent.
Original fictional illustration of Hull's credit-triangle approximation, hazard rate equal to spread divided by one minus recovery. The hazard rates are risk-neutral (spread-implied), not forecasts of default.
Hull's guidance on which to use: risk-neutral probabilities to value credit derivatives or the effect of default risk on the price of an instrument, real-world probabilities for scenario analysis of potential losses.
Spread duration
If government yields are unchanged and the spread moves, the price still moves. Fabozzi defines spread duration as the approximate percentage price change for a 100 bp change in the credit spread, with the benchmark yield held fixed, and it is zero for a Treasury. To first order:
PΔP≈−DsΔs,
where Ds is the spread duration and Δs is the spread change in decimal. It is computed like duration with the spread bumped instead of the yield, and it depends on which spread measure is meant. It ignores convexity. Fabozzi also cites empirical evidence that spread changes tend to scale with the spread level, so wide-spread bonds usually move by more basis points. See spread duration.
Continue learning
Three Programme lessons extend this page. Each has a public preview and the full lesson needs membership.
1. Calculation. A bond's credit spread is 240 bp over the risk-free rate and the assumed recovery rate is 40% of face. Using the credit triangle, what is the approximate average annual risk-neutral hazard rate? (Annual rates, spread quoted per annum.)
Answer.λˉ≈s/(1−R)=0.024/0.60=4.0% a year. It is risk-neutral, so it prices the bond rather than forecasting defaults, and it is approximate. If the assumed recovery were 20% instead, the same spread would imply 0.024/0.80=3.0%, which shows how much of the answer is the recovery assumption.
2. Multiple choice. Government yields are unchanged, but a corporate bond's credit spread widens by 50 bp. The bond's spread duration is 6. What is the approximate price change?
(a) +3%
(b) −3%
(c) −0.5%
(d) No change, because government yields did not move
Answer. (b). ΔP/P≈−6×0.005=−3%. Option (d) is the trap: a price depends on the benchmark yield plus the spread, so a spread move changes the price even when the benchmark is still. Option (c) forgets to multiply by the spread duration, and (a) has the wrong sign because a wider spread means a lower price. This is a first-order estimate, and convexity would make the true fall slightly smaller.
3. Interview-style. "If you were certain a corporate bond would not default, would its spread over Treasuries be zero?"
Answer. Not necessarily. Removing default removes the expected-loss and default-risk-premium parts of the spread, but other parts remain. Corporate bonds can be less liquid than Treasuries, although Hull cites research finding the liquidity component of spreads relatively small. Interest on US Treasuries is exempt from state tax, which Hull lists among the reasons dealers consider Treasury yields artificially low. Regulatory demand for Treasuries and their small capital charge push the same way. Embedded options can also distort the spread, as Fabozzi notes. A spread over Treasuries is a difference between two prices, not a pure measure of default compensation.
Sources
John C. Hull, Options, Futures, and Other Derivatives, 9th ed., Global Edition: Section 24.4 on estimating default probabilities from bond yield spreads, equation (24.2), the risk-free rate and asset swap spreads; Section 24.5 on real-world versus risk-neutral default probabilities; Section 25.1 on credit default swaps, bond yields and the CDS-bond basis; Section 9.1, Business Snapshot 9.1.
Frank J. Fabozzi, Bond Markets, Analysis, and Strategies, 9th ed.: Chapter 4 on spread duration; Chapter 5 on factors affecting the benchmark spread; Chapter 18 on the static (zero-volatility) spread and option-adjusted spread; Chapter 19 on option cost; Chapter 21 on measuring credit spread exposures.