Every number below uses annual compounding, a fictional government curve and one currency, and each quote carries its compounding label. Nothing here is market data.
A date, a payment, a rate
Let be the discount factor for a payment of 1 due in years. The spot rate , with annual compounding, is the rate that links the two:
The spot rate belongs to a date, not to an instrument. Any default-free payment due in three years is discounted at 4.40% on this curve, whatever bond it comes from. That is exactly what makes a coupon bond awkward. Hull points out that the price of a 5-year, 6% coupon bond does not by itself determine the 5-year zero rate, because part of the return arrives as coupons before year 5.
Why every cash flow gets its own rate
A coupon bond is a package of single payments. By the law of one price, a package of payments costs the same as the individual payments bought separately, so the bond is worth each payment times its own discount factor:
Discounting every payment at one common rate is a shortcut. Hull notes that traders sometimes use it and that using a different zero rate for each cash flow is more accurate. Tuckman's point is the same: if spot rates differ by term, each payment must be discounted at its own.
Extracting spot rates from coupon bonds
| Instrument | Price | Payments |
|---|---|---|
| 1-year zero-coupon bill | 96.6184 | 100 at year 1 |
| 2-year, 4% coupon bond | 100.0186 | 4 at year 1; 104 at year 2 |
| 3-year, 5% coupon bond | 101.7295 | 5 at years 1 and 2; 105 at year 3 |
Hull calls the method the bootstrap. Start with the instrument that has only one payment and work outwards, using each rate you have already found to strip the earlier payments out of the next price.
- Year 1. The bill pays only at year 1: , so .
- Year 2. The 2-year bond satisfies . With known, , so .
- Year 3. The 3-year bond satisfies , so and .
For a bond with coupon and price the step is , and each bond contributes exactly one new unknown.
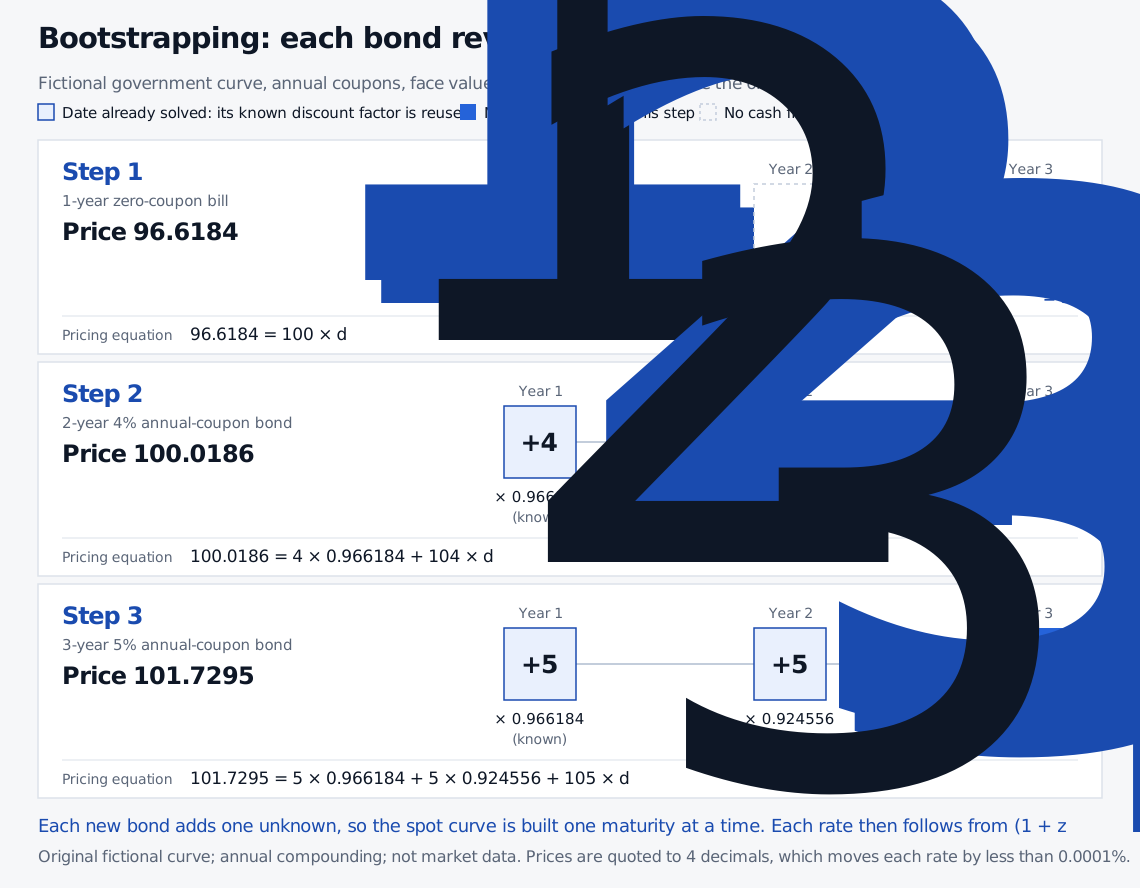
The prices were built from spot rates of 3.50%, 4.00% and 4.40% and rounded to four decimals, so the bootstrap recovers those rates when rounded to four decimals as well. The order matters. An error in the 1-year price feeds into and , so early inputs carry through to every later rate. The general case of many instruments is on the curve bootstrapping page.
Spot rate versus yield to maturity
| Payment | Amount | Spot rate | PV at own spot rate | PV at the 4.3724% yield | Spot PV minus yield PV |
|---|---|---|---|---|---|
| Year 1 | 5 | 3.50% | 4.8309 | 4.7905 | +0.0404 |
| Year 2 | 5 | 4.00% | 4.6228 | 4.5899 | +0.0329 |
| Year 3 | 105 | 4.40% | 92.2758 | 92.3491 | −0.0733 |
| Total | 101.7295 | 101.7295 | 0 |
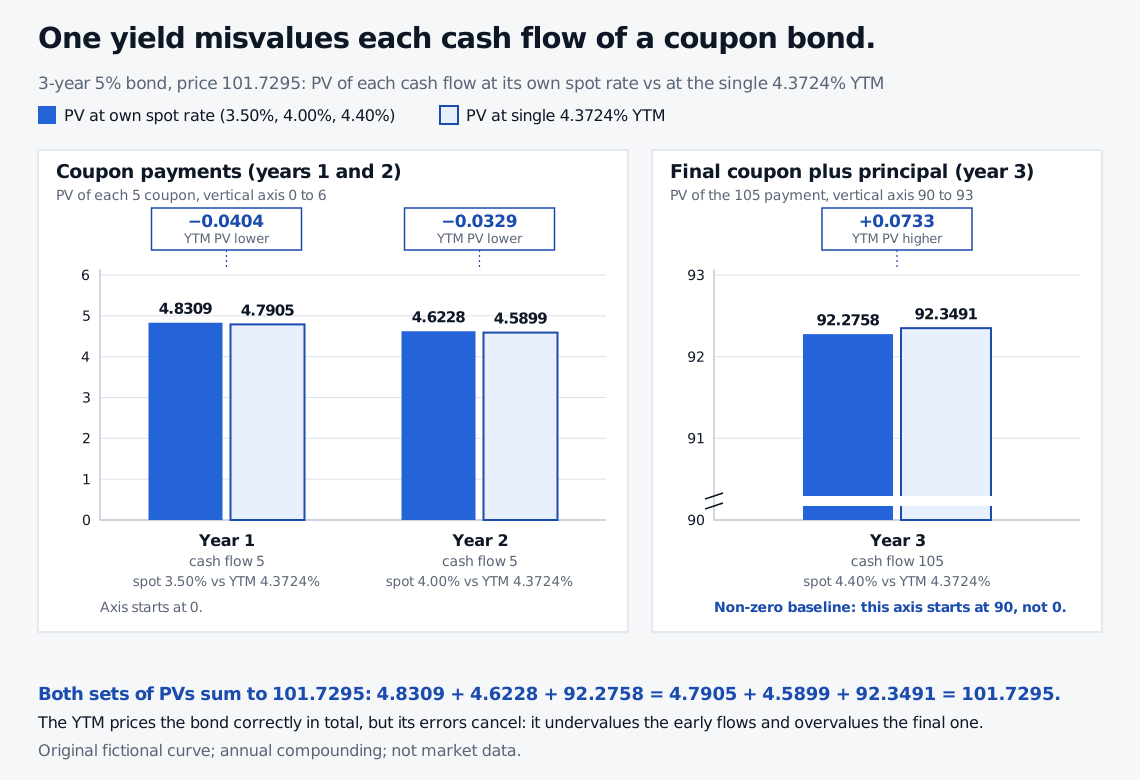
The single yield is higher than the year-1 and year-2 spot rates, so it discounts the early coupons too heavily. It is lower than the year-3 spot rate, so it discounts the final payment too lightly. The errors cancel inside this bond because the yield was solved from this bond's price. Use the same 4.3724% for a different payment pattern and they will not.
One spot rate, several quotes
| Maturity | Discount factor | Annual | Semiannual | Continuous |
|---|---|---|---|---|
| 1 year | 0.966184 | 3.5000% | 3.4699% | 3.4401% |
| 2 years | 0.924556 | 4.0000% | 3.9608% | 3.9221% |
| 3 years | 0.878817 | 4.4000% | 4.3526% | 4.3059% |
These are not three curves. They are one set of prices quoted three ways, and the more often interest compounds, the lower the quoted rate for the same growth. Hull's examples use continuous compounding, so a 5% five-year rate means . Tuckman uses semiannual compounding, matching Treasury coupons. A bare "4.40%" is incomplete until it names its compounding frequency, and for money-market rates its day-count convention as well.
Easy mistakes
- Reading a spot rate as a forecast. The 3-year spot rate is a price-implied annual rate for a 3-year loan. It is not a prediction of what the 3-year rate will be in a year.
- Calling a headline yield a spot rate. Quoted yields are usually yields to maturity or par yields, not zero rates. While a curve rises, the par yield sits below the zero rate: on the curve above, the 3-year par yield is 4.3755% and the 3-year zero rate is 4.40%.
- Treating interpolated points as observed. Between instruments, the curve is interpolated. Two sensible interpolation rules give different spot rates between the nodes.
- Dropping the label. 4.40% annual, 4.3526% semiannual and 4.3059% continuous are the same rate.
From three bonds to a working curve
The three-instrument bootstrap shows the idea, not production practice. Real curves start from a mixed set of inputs: Treasury bills or deposits at the short end, interest rate futures in the middle and swap rates beyond, with interpolation between nodes. A bootstrap reprices every input exactly. A smooth fit trades that for a better-behaved forward curve. The Federal Reserve Board's research dataset by Gürkaynak, Sack and Wright is an example of the second kind: it fits a six-parameter Svensson model to observed Treasury yields, and the paper obtains zero-coupon yields by integrating the model's forward rates. The Board describes the series as not an official statistical release. Check its documentation for the compounding convention before using the numbers.
Where to go next
Three lessons from SelfMadeQuant's Fixed Income and Interest Rate Models Programme extend this page. Each has a public preview; the full lessons require membership.
- Bootstrapping the Spot Curve from Market Instruments adds deposits, futures and swaps, and shows why the implied forward curve can look jagged.
- Bond Prices, Discount Factors, and the Law of One Price bootstraps from real semiannual Treasury prices and builds the arbitrage argument behind the law of one price.
- Spot Rates, Forward Rates, and the Term Structure Slope works in the semiannual convention and ties spot rates to forward rates and to the slope of the curve.
Sources
- John C. Hull, Options, Futures, and Other Derivatives, 9th ed., Global Edition, Chapter 4: Section 4.3 on zero rates, Section 4.4 on bond pricing with a zero rate for each cash flow, Section 4.5 on determining Treasury zero rates by the bootstrap method.
- Bruce Tuckman, Fixed Income Securities: Tools for Today’s Markets, 2nd ed., Chapter 1 on discount factors and the law of one price, Chapter 2 on spot rates.
- Refet S. Gürkaynak, Brian Sack and Jonathan H. Wright, The U.S. Treasury Yield Curve: 1961 to the Present, Federal Reserve Board FEDS 2006-28.
- Federal Reserve Board, Treasury yield curve estimates (research data page).