A forward interest rate is the rate fixed today for lending or borrowing over a future period. See how spot rates imply it, why it is a break-even rate rather than a forecast, and how an FRA locks it.
Forward interest rate
A forward interest rate is the rate for lending or borrowing over a future period, from time T1 to time T2, that is fixed today. An implied forward rate is the one already contained in today's spot interest rates: it is the rate for that future period at which lending to T2 directly and lending to T1 and then relending to T2 end with the same money. "The 1-year rate, 1 year forward" is the rate on a one-year loan that starts in a year.
Two neighbours share the word. A forward price is the delivery price of an asset in a forward contract. A forward rate is the price of a forward loan, quoted as a rate. The two are linked: a one-year zero-coupon bond bought in a year has a forward price of d(2)/d(1)=1/1.045024=0.956916 per unit of face value, and 1/0.956916−1=4.5024% is the forward rate found below.
Conventions throughout: annual compounding, whole-year periods, one currency, government credit and a fictional curve. Nothing here is market data.
Reading forwards off a curve
A corporate treasurer must refinance a one-year loan in a year and asks what today's curve says about that rate. The yield curve she is given is a zero curve:
Maturity
Spot rate zn
Growth factor (1+zn)n
1 year
3.50%
1.035000
2 years
4.00%
1.081600
3 years
4.40%
1.137893
A spot rate is the return on a single payment, so a two-year investment at 4.00% grows by 1.0816. The same money can be viewed as one year at 3.50% followed by a second year at some rate f1,2. Consistency between the two views fixes that rate. In general, for dates T1<T2, with d(T) the discount factor for date T:
The last is a two-year rate starting in one year. It is the geometric average of the two one-year forwards: 1.045024×1.052046−1=4.8529%. Every spot rate is an average of the forwards up to its date, which is why par, zero and forward curves can all be built from one set of prices.
Why the number is forced
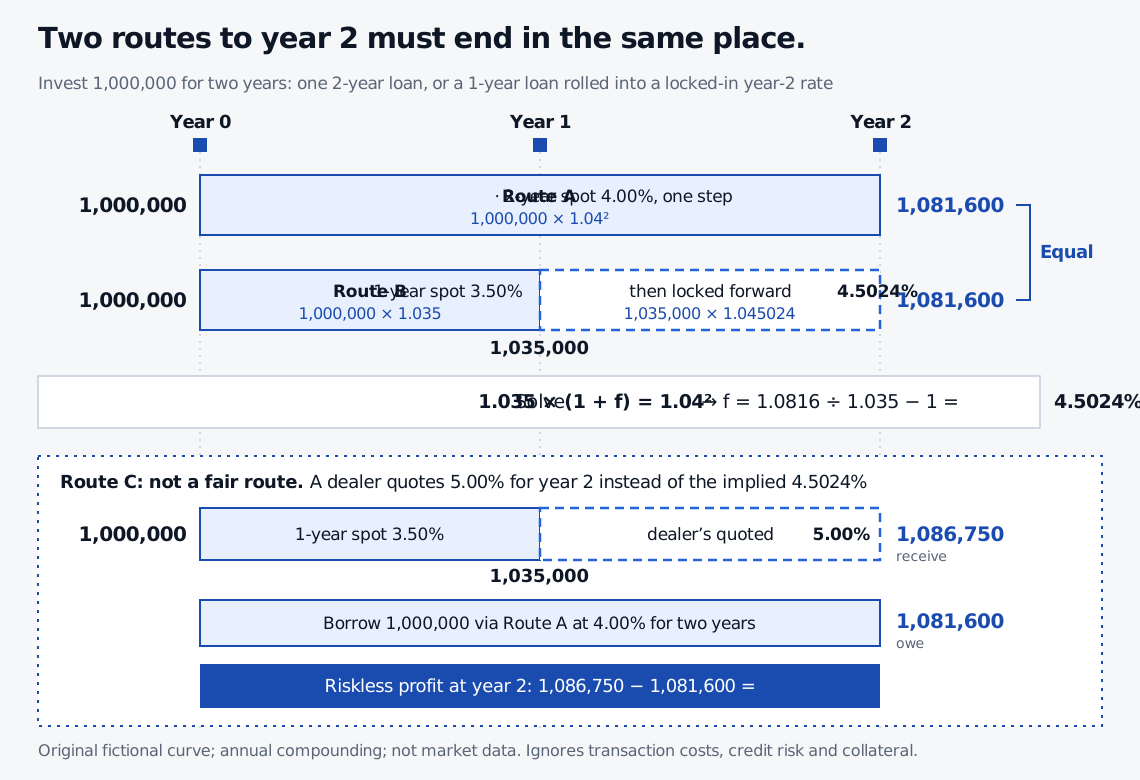
Take 1,000,000 USD. Route A lends it for two years at 4.00% and receives 1,000,000×1.042=1,081,600.00. Route B lends it for one year at 3.50%, receiving 1,035,000, and relends that sum for year 2 at 4.5024%, receiving 1,035,000×1.045024=1,081,600.00. The routes are identical by construction.
Route B's second leg can be agreed today with a counterparty, so 4.5024% is a rate someone can lock, not just a calculation. If the market offered a different rate for year 2, one of the two routes would beat the other with no risk. That is arbitrage in the sense of the law of one price: two ways to end year 2 with the same cash flows must cost the same.
Suppose a dealer offers to borrow for year 2 at 5.00%, which is above the implied 4.5024%:
Borrow 1,000,000 for two years at 4.00%. At year 2 you owe 1,081,600.
Lend the 1,000,000 for one year at 3.50%. At year 1 you receive 1,035,000.
Lend that 1,035,000 to the dealer for year 2 at the agreed 5.00%. At year 2 you receive 1,086,750.
Nothing is paid out today, and at year 2 you keep 1,086,750−1,081,600=5,150 USD whatever rates do. Its present value at the two-year spot rate is 5,150/1.0816=4,761.46 USD. A quote below 4.5024% reverses the trade. This ignores bid-offer spreads, differences between borrowing and lending rates, credit risk and collateral costs, which are what keep real quotes within a band around the implied forward.
Timeline from year 0 to year 2 comparing routes for 1,000,000 USD. Route A lends for two years at the 4.00 percent spot rate and ends at 1,081,600.00. Route B lends for one year at 3.50 percent to reach 1,035,000, then lends for year 2 at the implied forward rate of 4.5024 percent and also ends at 1,081,600.00. A third route uses a mis-quoted 5.00 percent forward for year 2 and ends at 1,086,750, which is 5,150 more than the 1,081,600 owed on a two-year loan at 4.00 percent.
Original fictional illustration. Annual compounding, one currency, government credit, no bid-offer spreads, funding spreads, credit or collateral costs. The 5.00 percent quote is a hypothetical dealer error used to show the arbitrage.
One rate, two quotes
Compounding changes the number but not the economics. Under continuous compounding, the spot rates are ln1.035=3.4401% and ln1.04=3.9221%, and Hull's forward formula is
That is ln(1.045024), the same forward rate quoted as a continuously compounded rate. The formula says the two-year continuous rate is the time-weighted average of the year-1 rate and the year-2 forward: (3.4401%+4.4040%)/2=3.9221%. Reading 4.4040% as an annual rate would understate the year-2 rate by about 10 basis points, so state the convention beside every forward you quote.
Shrink the period toward zero and the limit is the instantaneous forward rate, the rate for an infinitesimal period starting at T. In continuous compounding it equals R+T∂R/∂T, where R is the zero rate to T. That makes the forward curve lie above the zero curve while the zero curve rises. It is also −∂lnP(0,T)/∂T, where P(0,T) is the price of a zero-coupon bond paying 1 at T. It is a rate implied today for a date, which is a different object from the future short rate that a model treats as random.
Locking a forward with an FRA
A forward rate agreement (FRA) is the traded way to fix a forward rate. It is an over-the-counter agreement that a stated rate applies to a stated principal over a stated future period; see forward rate agreement. In an FRA one party pays the fixed rate and receives the realised rate for the period, and the other does the reverse. A portfolio of FRAs is also one way to view an interest rate swap.
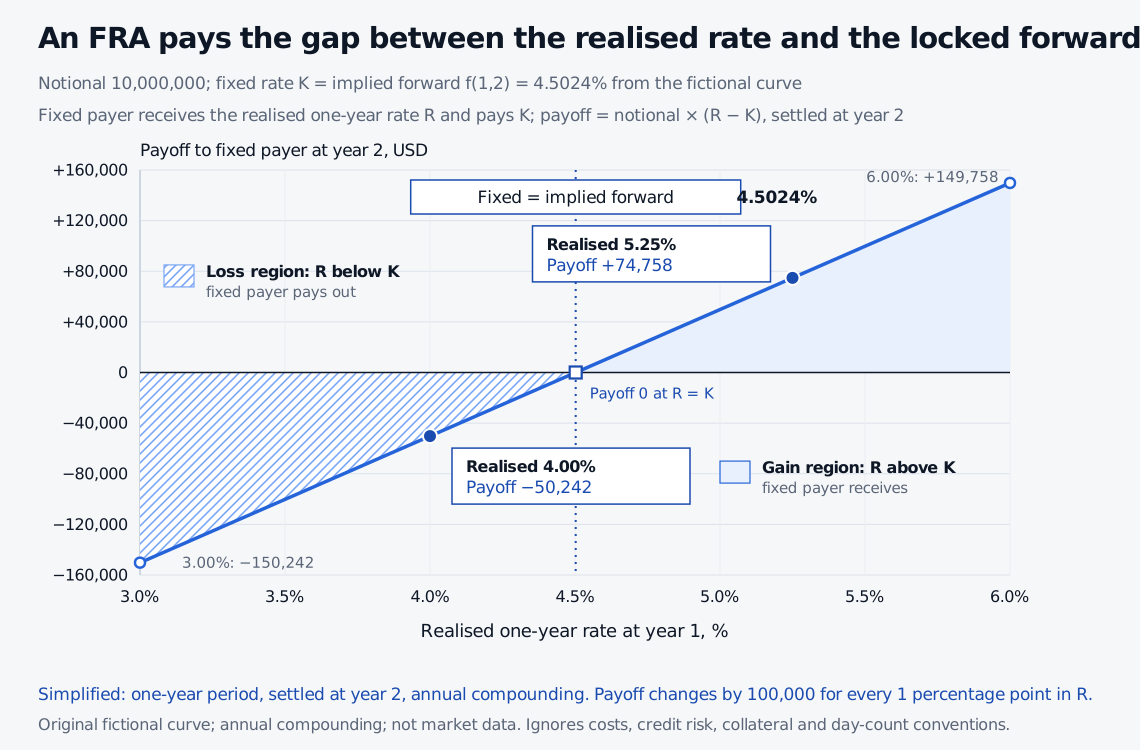
Take a notional of 10,000,000 USD and a fixed rate of 4.5024% for year 2. This simplified version uses one annually compounded period settled at year 2. Let R be the one-year rate that actually applies from year 1 to year 2. The party paying fixed receives
N(R−K)=10,000,000×(R−4.5024%).
Realised R
Payoff to fixed payer at year 2
3.00%
−150,241.55
4.00%
−50,241.55
5.25%
+74,758.45
6.00%
+149,758.45
For a borrower that must refinance 10,000,000 USD for year 2, the loan interest plus the FRA settlement is the same in every row. At R=6.00% the interest is 600,000 and the FRA pays 149,758.45; at R=3.00% the interest is 300,000 and the FRA costs 150,241.55. The net cost is 450,241.55 either way, which is 4.5024%. The +74,758.45 at 5.25% is worth 74,758.45/1.0525=71,029.41 USD at year 1, discounted at 5.25%.
The FRA costs nothing to enter because the fixed rate equals the implied forward; Hull's valuation rule is to compute the payoff as if the forward rate is realised and discount it. Afterwards the value moves with the curve: in this annual setting the fixed payer's value is N(fnow−K)d(T2), with fnow the current forward and d(T2) the current discount factor for year 2.
Line chart of the year-2 payoff to the party paying fixed on a forward rate agreement with 10,000,000 USD notional and a fixed rate of 4.5024 percent, against the one-year rate realised at year 1 from 3 percent to 6 percent. The payoff is a straight line that crosses zero at 4.5024 percent. It is negative 150,241.55 at 3.00 percent and negative 50,241.55 at 4.00 percent, and positive 74,758.45 at 5.25 percent and positive 149,758.45 at 6.00 percent. The points at 4.00 and 5.25 percent are marked.
Original fictional illustration. Simplified FRA: annual compounding, a one-year period, settlement at year 2. Real FRAs settle at the start of the period on a discounted basis with money-market day counts. The realised rates are a scenario grid, not forecasts.
That simplification matters in practice. A market FRA is usually settled at the start of the period, with a payment of N(R−K)τ/(1+Rτ) where τ is the accrual fraction from a money-market day count. Hull's text assumes LIBOR as the reference rate, and markets have since moved to overnight benchmarks (see risk-free rate for the LIBOR retirement), so a contract's reference rate and day count are part of its definition.
A forward is a break-even, not a forecast
The common mistake is to read 4.5024% as the market's prediction of next year's one-year rate. What the algebra shows is narrower. It is the one-year rate in a year at which a saver who rolls one-year deposits does exactly as well as one who buys the two-year deposit today.
Check it with the 1,035,000 held at year 1. At a realised rate of 4.00% the roller ends with 1,076,400, which is 5,200 short of 1,081,600. At 5.25% the roller ends with 1,089,337.50, which is 7,737.50 ahead. At 4.5024% the two tie. The forward is the price of the tie, and it is a price you can trade at, so a later outcome above or below it does not make it a mistake.
Whether it also equals the expected future rate is a separate question, and the theories Hull sets out disagree:
Expectations theory: the forward rate equals the expected future zero rate for that period. Today's curve then says the market expects the one-year rate to rise from 3.50% to about 4.50% in a year. See expectations hypothesis.
Liquidity preference theory: forward rates exceed expected future rates, because lenders prefer short maturities and borrowers prefer to fix long. Part of the 4.5024% would then be a term premium, and the expected rate would be lower.
Market segmentation theory: each maturity has its own supply and demand, so there need be no tie between a forward rate and any expectation.
One curve cannot separate the expected rate from the premium. A forward rate is a trustworthy break-even and an uncertain forecast, and the split between the two needs a model or outside data. The yield curve page treats the same three theories from the standpoint of curve shape.
Forwards from real curves
Forwards are differences of products of rate and time, so they magnify errors in the spot curve. In continuous compounding, Hull's equation can be written RF=R2+(R2−R1)T1/(T2−T1). For one-year periods, a 1 basis point error in R1 at T1=8 moves the year-9 forward by 8 basis points. Forwards therefore depend on how the curve was built and interpolated; see curve bootstrapping. A published par yield is not a zero rate, so compute forwards from zero rates or discount factors rather than directly from par yields.
Where to go next
Two lessons in SelfMadeQuant's Fixed Income and Interest Rate Models Programme extend this page. Each has a public preview; the full lessons require membership.
John C. Hull, Options, Futures, and Other Derivatives, 9th ed., Global Edition, Chapter 4: Section 4.6 on forward rates and the instantaneous forward rate, Section 4.7 on forward rate agreements and their valuation, Section 4.10 on expectations, market segmentation and liquidity preference theories.
Bruce Tuckman, Fixed Income Securities: Tools for Today’s Markets, 2nd ed., Chapter 2 on forward loans, forward rates and their relation to spot rates and curve slope.