An upward-sloping yield curve has higher longer-term yields. See why a synthetic 3%/4% zero curve implies a 5.0097% forward, without guaranteeing future rate rises.
Upward-sloping yield curve
An upward-sloping yield curve, also called a normal yield curve, has higher yields at longer maturities over a specified segment. For a quant, the slope helps determine the cost of fixing future borrowing or lending today. It does not establish that future short-term rates will actually rise.
The word normal names a familiar shape; it does not mean the curve must have that shape, or that an investment on it is safe. An upward slope can also occur when the yields themselves are negative.
Higher yields for which payments?
Before interpreting the yield curve, identify its observation date, currency, instruments, rate convention and maturity range. A one-to-two-year segment can slope upward while a later segment slopes downward.
The curve family matters. A spot interest rate, or zero rate, prices a single payment at a specified maturity. A par yield is the coupon rate that prices a bond at face value under a specified payment schedule. A coupon bond’s yield to maturity compresses all its payments into one discount rate. Their curves are related through prices, but they are not interchangeable. The Bank of England’s terminology guide explains the zero-rate and coupon-bond-yield distinction.
Comparisons should also match nominal or real basis, credit quality, liquidity and the collateral or funding framework. A long corporate yield above a short government yield need not measure a pure maturity effect. Likewise, using different compounding or day-count conventions can distort a quoted spread.
A 4% two-year rate contains a higher second-year forward
Use a synthetic USD zero curve observed today, with a 3% one-year spot rate and a 4% two-year spot rate. Both use annual-effective compounding at exact whole-year dates. Assume certain payments, a single consistent pricing framework, frictionless borrowing and lending, and no taxes or fees. These are illustrative assumptions, not live market terms.
The two-year minus one-year spread is 1 percentage point, or 100 basis points. This establishes an upward slope between the two nodes; it says nothing about unobserved maturities.
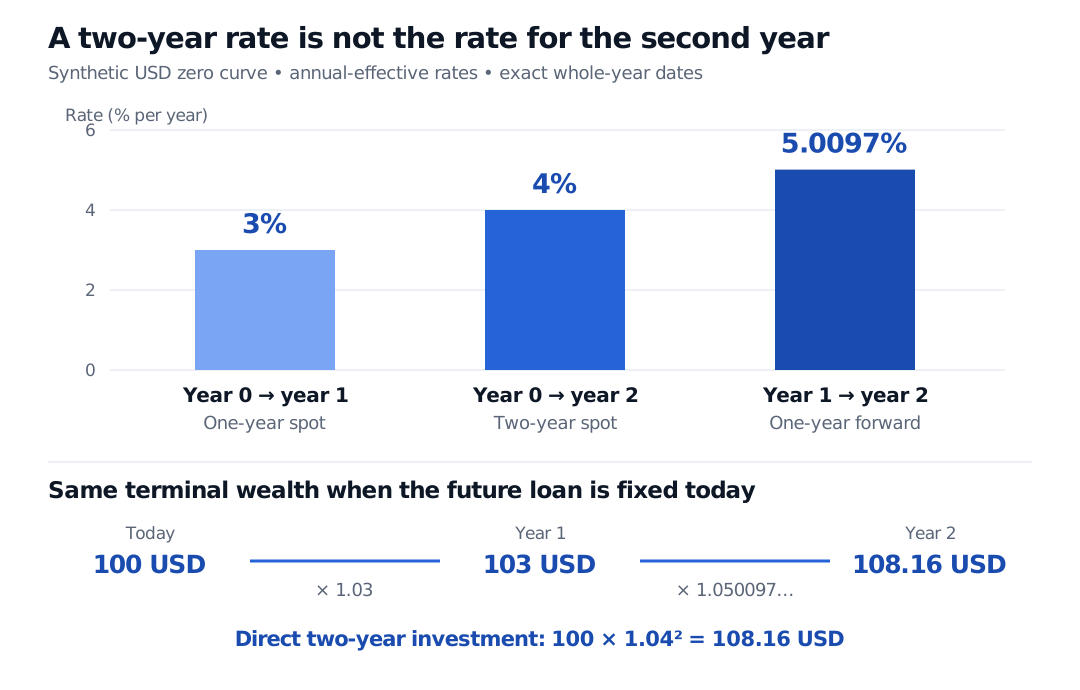
Investing 100 USD for two years at 4% gives 100(1.04)2=108.16 USD. Investing it for one year at 3% gives 103 USD. To lock the same final amount through a second one-year loan, its annual-effective rate must satisfy
The implied forward interest rate is above both spot rates. The second year must earn more than 4% to bring the annualised two-year return up to 4% after the first year earns only 3%. With annual-effective compounding, the two-year rate is a geometric average: simply doubling 4% and subtracting 3% would give 5%, which is only an approximation here.
Synthetic annual-effective rates: 3% for year zero to one, 4% annualised for years zero to two, and an implied 5.0097% for year one to two. Investing 100 grows to 103 in the first year and 108.16 after the locked second-year forward; 100 invested for two years at 4% also reaches 108.16.
Original synthetic USD example. Bars compare annual-effective rates for the explicitly labelled periods; the middle bar covers both years. The future-period forward is fixed today, not assumed to be a future observed spot rate.
Check the trade, including its direction
The discount factors, or prices today of one USD paid at each date, are
For a forward loan of 100 USD paid out at year 1, buy a two-year zero-coupon payment of 100D1/D2=105.0097087… USD. Finance that purchase by borrowing against a repayment of 100 USD at year 1:
Dated position
Today
Year 1
Year 2
Buy the two-year payment
−97.087379
0
+105.009709
Borrow, repaying 100 at year 1
+97.087379
−100
0
Net cash flow
0
−100
+105.009709
Amounts in USD, rounded to six decimals; today’s costs cancel exactly before rounding.
This is forward lending: the lender pays money at year 1 and receives principal plus interest at year 2. Its zero initial value gives −100D1+100(1+f1,2)D2=0. The matching cash flows establish the no-arbitrage rate in the assumed framework. They do not require anyone to forecast next year’s spot rate correctly.
Notice that the spot quotes rise while the discount factors fall. A curve of rates is not a curve of prices. Here a later dollar is worth less today; higher longer-term rates do not mean higher discount factors. The signs and maturities of rates both matter in general.
For the cash-flow foundation, Bonds and Yields develops bond pricing and the distinction between coupons, spot rates and yields to maturity. Its preview is public; the full lesson requires membership.
Reading the slope without turning it into a promise
An upward slope can be consistent with expected policy tightening as growth or inflation rises. It can also reflect compensation for holding longer-duration bonds, or changes in demand and supply at particular maturities. The RBA’s explainer describes these channels and the interest-rate uncertainty that motivates the “normal” label.
The term premium prevents a mechanical conversion from today’s forward into tomorrow’s expected spot rate. A positive premium can contribute to an upward curve even when expected short rates are unchanged. Premiums can also be negative. The Federal Reserve’s term-structure model documentation explicitly allows either sign and explains why extracting expectations requires a model. The expectations hypothesis is an additional assumption, not a consequence of the slope.
Nor does the higher long yield guarantee a better return over a shorter holding period. Selling the longer bond before maturity exposes its price to rate changes. Borrowing short to buy it also leaves future refinancing costs uncertain unless those costs are locked. In the example, locking the second-year funding or lending rate leads back to the implied forward, rather than creating a free gain from the 3%/4% spread.
Sources
John C. Hull, Options, Futures, and Other Derivatives, ninth Global Edition, Pearson, 2018: §4.6, pp. 108–110 (forward rates and borrowing/lending replication), and §4.10, pp. 118–119 (expectations, market segmentation and liquidity preference theories). The original calculation here uses annual-effective compounding rather than Hull’s continuous-compounding illustration.
Bank of England, Yield curve terminology and concepts, especially nominal zero-coupon yields, nominal forward rates and footnote 3. Checked 26 October 2026.
Reserve Bank of Australia, Bonds and the Yield Curve, especially “Normal yield curve,” investor risk perceptions, and demand and supply. Checked 26 October 2026.
Board of Governors of the Federal Reserve System, Three-Factor Nominal Term Structure Model, introduction and Q&A on the definition of term premiums and the limits of extracting expectations. Checked 26 October 2026.