See why two indices holding the same stocks can have different returns, how divisors handle splits, and why price and total-return benchmarks must be distinguished.
Stock index
A stock index is a calculated measure of the performance of a specified basket of stocks, assembled and maintained under an index methodology. It is also called an equity index. It can serve as a portfolio benchmark or the underlying reference for a financial contract. Its selection and weighting rules determine which market exposure it measures.
Knowing the company names is not enough. Two indices containing exactly the same stocks can report different returns because they assign different weights.
Two companies, two answers
Consider two fictional companies, each with one ordinary share class. All prices are in USD per share. The share counts stay fixed during one holding period; there are no dividends, corporate actions, constituent changes or rebalancing.
Company
Shares outstanding
Starting price
Starting market cap
Price change
Ending price
A
10 million
20
200 million USD
+10%
22
B
5 million
40
200 million USD
−5%
38
For full market-cap weighting, each company's weight is its market capitalisation divided by the combined market cap. Both start at 50%. The index's one-period price return is the sum of the constituent returns multiplied by their beginning-of-period weights:
Rcap=0.5(10%)+0.5(−5%)=2.5%.
Check the answer in dollars: A's market cap rises to 220 million USD and B's falls to 190 million USD. The combined value increases from 400 million to 410 million USD, a gain of 2.5%.
For price weighting, weights are proportional to share prices. A starts with weight 20/60=1/3 and B with weight 40/60=2/3:
Rprice-weighted=31(10%)+32(−5%)=0%.
Here a hypothetical basket holding one share of each stock costs 60 USD initially and remains worth 22+38=60 USD. B's higher share price gives it twice A's initial influence, even though the two companies have equal market caps.
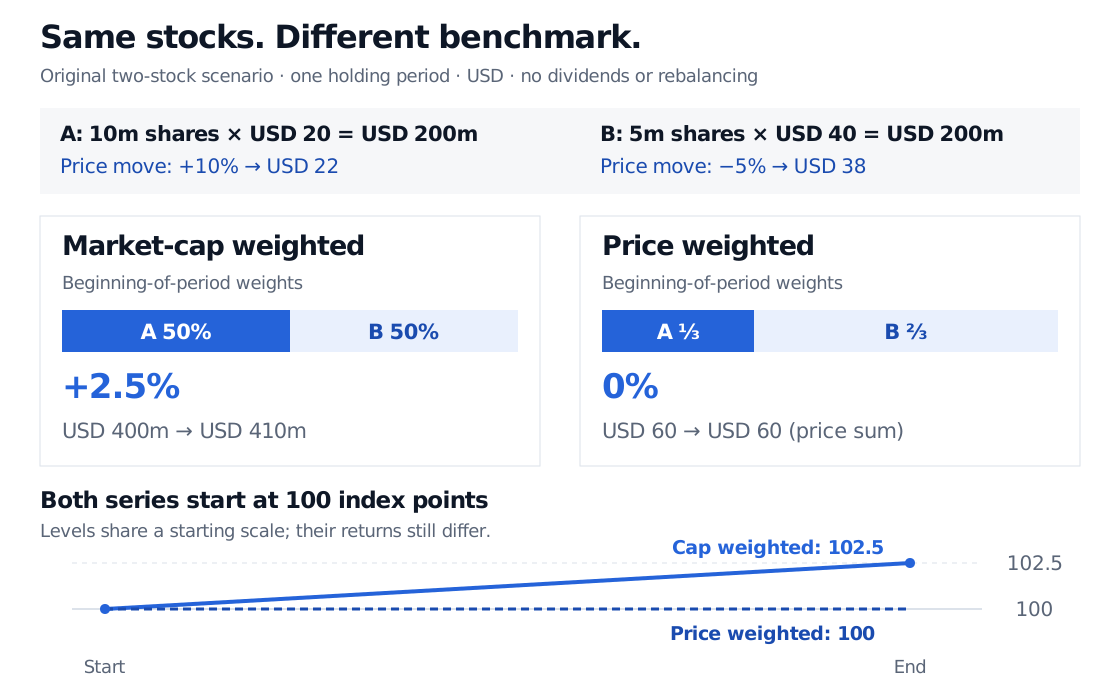
Two fictional stocks have equal starting market caps of 200 million USD. A gains 10% and B loses 5%. Market-cap weights of one-half each produce a 2.5% gain and an index level of 102.5 from 100; price weights of one-third and two-thirds produce zero return and an unchanged level of 100.
Original one-period example in USD, before dividends and without rebalancing. Both indices start at 100 points. Lines connect the two observations; they do not represent an observed path within the period.
Neither calculation is a mistake. They describe different portfolios. The arithmetic mean of constituent percentage returns happens to match the cap-weighted answer here because the starting market caps are equal; it is not a universal index formula. S&P DJI's Methodology Matters explains how weighting changes a constituent's influence.
The level is a scale; the divisor preserves continuity
An index level is quoted in points, not the price in dollars of purchasing its constituent companies. For the simple full-cap index above, choose a divisor of 4 million USD per point:
It=dt∑iPi,tQi,t.
Here Pi,t is a share price, Qi,t the shares included, and dt the divisor. The levels are 400/4=100 initially and 410/4=102.5 finally, using millions of USD consistently. Changing the starting scale would not change the percentage return.
The divisor also prevents specified non-market changes from creating artificial jumps. Consider a separate event at the original starting prices: B makes a mechanical 2-for-1 stock split, with no other repricing. Its price halves from 40 to 20 USD while its shares double from 5 million to 10 million. Its market cap stays at 200 million USD, so the full-cap index needs no divisor change for this split alone.
The simple price-weighted index uses the sum of prices divided by a divisor. Before the split, 60/0.6=100. Afterward, the price sum is 40 USD. Resetting the divisor to 0.4 keeps the level at 40/0.4=100. It also leaves A and B with equal price weights going forward. Keeping the level continuous does not preserve the old relative weights.
This is why a price-weighted index is not perpetually the raw average share price. S&P DJI's index mathematics overview describes the divisor's scaling and continuity roles; the applicable methodology specifies each event's treatment.
Which version belongs beside your portfolio?
Weighting and return type are separate choices. A price-return index omits regular dividend income. A total-return index incorporates dividends under a reinvestment convention. A gross total-return series and a net total-return series can differ because the latter applies specified withholding-tax assumptions. Those assumptions need not match a particular investor's taxes. See the provider's total-return calculation rules, pages 21–22.
Likewise, full-cap weighting differs from float-adjusted weighting, which uses the shares eligible under the provider's investability rules. Some methodologies also impose concentration caps. An equal-weighted index resets equal allocations at its scheduled rebalances; price movements then cause weights to drift. The provider's rules govern eligibility, float, caps and maintenance. The label “stock index” alone settles none of these choices.
When selecting a benchmark, match its constituent universe, weighting, return type, currency and measurement period to the comparison you intend. The example's cap-weighted and price-weighted indices would judge the same portfolio differently despite sharing every constituent.
The index is a calculation. An index fund or exchange-traded fund that seeks to track it is an investment vehicle whose realised return also reflects its implementation and costs, as the SEC explains in its index-fund guide. For the underlying ownership claim and the split between capital gain and income, the Equities primer provides a public preview; the full lesson requires membership.
Practice: did the fund beat its benchmark?
A fictional fund reports a 3% total return over one interval. Its benchmark's price index rises from 200 to 204 points. The benchmark credits 3 dividend points at the final close and reinvests them then, with no withholding tax or costs. Both returns use the same currency and measurement times. Did the fund outperform the benchmark on this gross total-return basis?
Answer. No. The benchmark price return is (204−200)/200=2%, but its gross total return is
200204+3−1=3.5%.
The fund trails by 0.5 percentage points. Comparing its 3% total return with the benchmark's 2% price return would omit the benchmark's dividend income.
Sources
John C. Hull, Options, Futures, and Other Derivatives, Ninth Edition, Global Edition, Pearson, 2018, §3.5, pp. 84–85: hypothetical stock portfolios, weights, price weighting, market-cap weighting and reinvested dividends.
S&P Dow Jones Indices, Methodology Matters: selection, weighting and float adjustment. Checked 25 October 2026.
S&P Dow Jones Indices, Index Mathematics Methodology, September 2026, pp. 6–8, 15–16 and 21–22: capitalization and price weighting, equal-weight maintenance, gross and net total returns. Checked 25 October 2026.
SEC Investor.gov, Index Funds: fund structures, fees, trading costs and tracking differences. Checked 25 October 2026.