A parametric model is a family of probability distributions described by a fixed, finite-dimensional vector of unknown parameters. Choosing the family restricts which distributions are possible; estimating the parameters selects a member of that family. For a quant, the attraction is compression: a few fitted numbers can produce an entire loss distribution, event-count forecast or return model. The cost is that the chosen family may exclude important behaviour.
A common notation is
where is fixed for the model specification, is the parameter space, and is a candidate distribution. More observations help estimate ; they do not automatically add a parameter for each observation. This is the standard finite-dimensional distinction described by Wasserman and Fithian's statistical-model notes.
“Parametric” does not mean normal or linear. A Bernoulli distribution has one unknown success probability; a normal distribution with unknown mean and variance has two parameters. A nonlinear response curve can also be parametric when its form is specified by a fixed number of coefficients. Conversely, estimating just a mean does not make an otherwise unrestricted distribution family parametric: the dimension refers to the model, not merely the quantity of interest.
Five minutes of alerts
Consider hypothetical operational alerts recorded in five equal one-minute windows:
Suppose the counts are modelled as independent and identically distributed Poisson variables with a common unknown arrival rate alerts per minute. With each window lasting minute, its count mean is . The Poisson family imposes
At , the distribution is concentrated at zero. The window length is known; the rate is the single unknown parameter. Independence and a common rate are additional modelling assumptions, not consequences of being parametric.
For positive , the joint likelihood multiplies the five count probabilities. Its log-likelihood, with independent of , is
Differentiating gives . Thus maximum likelihood estimation gives
This selects a complete fitted distribution, not just a fitted average. In the next one-minute window, if the same assumptions continue to hold, the fitted probability of no alerts is
This is a plug-in model probability. It does not account for uncertainty in the estimated rate. NIST's Poisson reference provides the count law and sample-mean MLE.
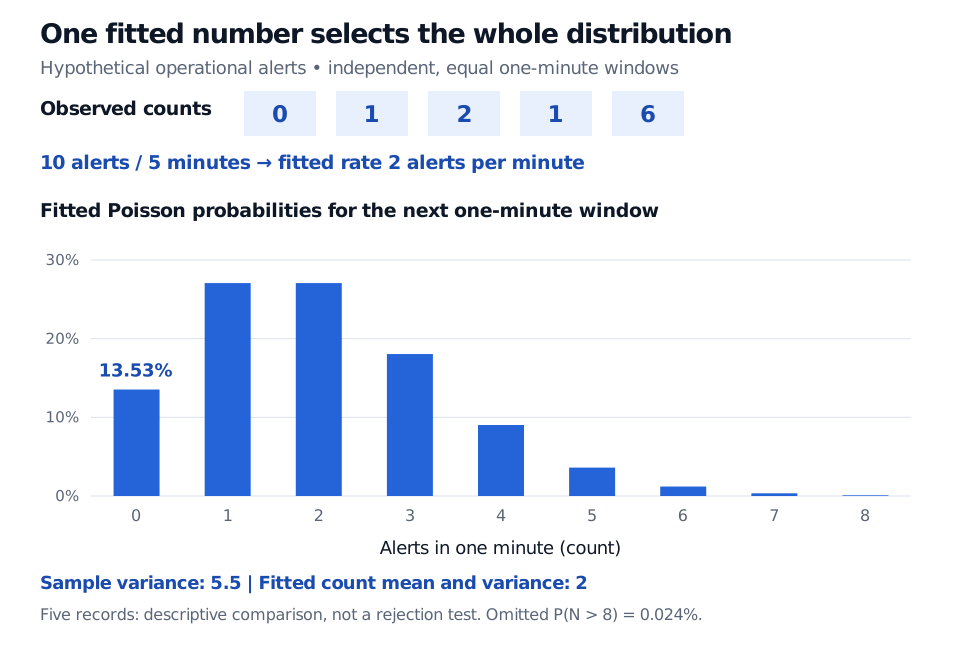
Original hypothetical example. Bars show fitted probabilities, not observed frequencies. Probability above eight alerts is 0.024%; the full model has no finite count ceiling.
Fitting is not checking
The fitted Poisson count mean and variance both equal 2. Yet these five observations have unbiased sample variance
The numerical comparison concerns counts per equal window; it is distinct from the rate's alerts-per-minute units. With only five records, the discrepancy is descriptive evidence to investigate, not a formal rejection test. It does not establish overdispersion in the underlying population, explain the count of six, or prove dependence. A longer record could reveal clustering, a changing rate or a count family with a separately adjustable dispersion.
That is the central tradeoff. Within this family, changing one number changes the zero probability, tail probabilities, mean and variance together. If operational alerts arrive in bursts, a precise estimate of the average rate cannot repair the missing burst mechanism. Parameter uncertainty and model risk are different problems.
A nonparametric model allows a broader, typically infinite-dimensional distribution family; it still needs assumptions such as independent sampling or smoothness. The choice is about how much structure to impose before observing the data, not whether to use mathematics or make assumptions.
To work through estimation after specifying a family, Estimation and Maximum Likelihood derives Bernoulli and normal estimates and explains boundary cases and misspecification. The full lesson requires membership; a public preview is available.
Sources
- Larry Wasserman, All of Statistics: A Concise Course in Statistical Inference (Springer, 2004), §6.2, “Parametric and Nonparametric Models.” University-hosted text.
- Will Fithian, “Statistical decision theory”, UC Berkeley, 2023, sections “Statistical models” and “Parametric vs nonparametric models.”
- NIST/SEMATECH, “Poisson Distribution”, e-Handbook of Statistical Methods.