Skip to content

Nonparametric model

A model class whose flexibility is not fixed by finitely many parameters. Compare an empirical return distribution with a normal fit and see which assumptions remain.

A nonparametric model is a statistical model whose possible distributions or functions are not restricted to a family described by a fixed, finite-dimensional parameter vector. The unknown object may be an entire distribution function or regression curve.

For a quant estimating the distribution of returns, this offers flexibility beyond choosing a normal or another named family. It also changes the problem: the shape must be learned from limited data, including regions where observations are scarce.

A distribution, rather than two unknown numbers

A normal distribution is determined by its mean and variance. Its shape is otherwise fixed: this is a parametric model. By contrast, consider independent, identically distributed observations from an unknown distribution on the real line:
X1,…,Xn∼iidF,F∈Fall,X_1,\ldots,X_n\overset{\mathrm{iid}}{\sim}F, \qquad F\in\mathcal{F}_{\mathrm{all}},

where Fall\mathcal{F}_{\mathrm{all}} is the class of all cumulative distribution functions on the real line. This is a nonparametric model. The entire FF is unknown; estimating a scalar feature such as its mean, when that mean exists, does not turn the model into a parametric one.

One estimator of FF is the empirical cumulative distribution function:
F^n(x)=1n∑i=1n1{Xi≤x}.\widehat F_n(x)=\frac{1}{n}\sum_{i=1}^{n}\mathbf{1}_{\{X_i\le x\}}.
It puts mass 1/n1/n at each observation, adding the masses when observations repeat. The estimate is discrete even if the population distribution is continuous. The model class and the fitted estimate are different objects.

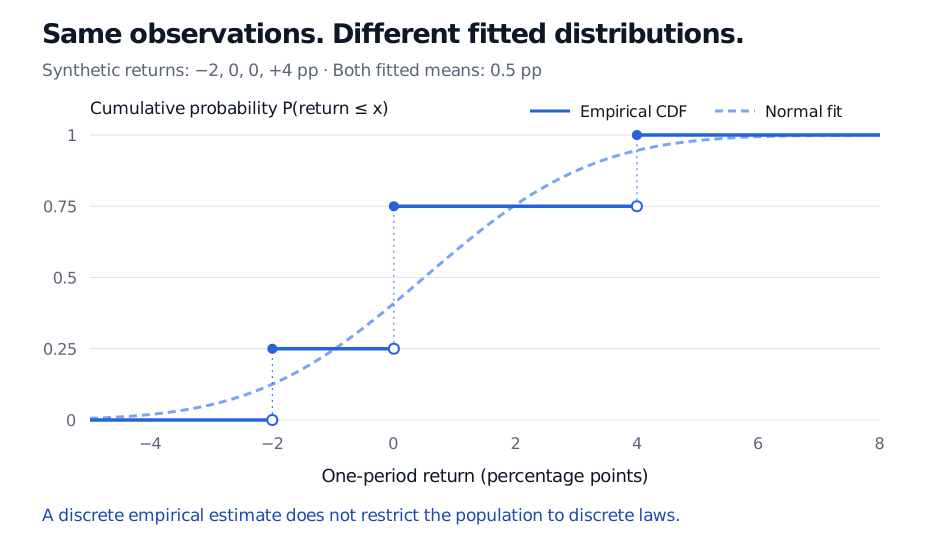
Take four synthetic one-period returns, measured in percentage points (pp): −2,0,0,4-2,0,0,4. The empirical distribution puts probability 0.250.25 at −2-2, 0.500.50 at 00 and 0.250.25 at 44. Its mean is 0.50.5 pp.

A normal maximum-likelihood fit to the same observations also has mean 0.50.5 pp, with variance 4.75 pp24.75\ \text{pp}^2 using divisor nn. The two fitted distributions nevertheless answer tail questions differently: the empirical probability of a return strictly above 44 pp is zero; the fitted normal probability is approximately 5.4%5.4\%.
Synthetic return CDFs: empirical jumps at −2, 0 and 4 pp compared with a fitted normal CDF.
Figure: Original synthetic comparison. Solid steps show the empirical CDF; the dashed curve is the normal maximum-likelihood fit. Filled endpoints belong to the steps; hollow endpoints are excluded.

Neither answer establishes the true tail probability. Zero empirical mass beyond the sample maximum means that no such observation occurred; it does not mean a larger return is impossible. The normal fit supplies an extrapolation through its assumed shape. Four observations provide little evidence about that extrapolation.

Flexibility still has conditions

“Nonparametric” does not mean “no parameters,” “no assumptions” or “automatically robust.” In the model above, independence and a common distribution are explicit assumptions. A historical return window may violate them through serial dependence or changing volatility. Density and regression estimators often add smoothness assumptions and tuning choices; more flexibility can increase estimation uncertainty.

Nor does a large number of fitted probabilities alone make a model nonparametric. If the outcome space is fixed in advance to KK categories, their probabilities form a finite-dimensional family with K−1K-1 free parameters because they sum to one. A fixed-bin multinomial model is parametric. In the unrestricted distribution model, the possible support and shape are not confined to that fixed list.

To develop the contrasting finite-dimensional framework, read Parametric Statistical Models and the Likelihood. The full lesson requires membership; its public page provides a preview.

Sources

  • Larry Wasserman, All of Statistics: A Concise Course in Statistical Inference, Springer, 2004, §6.2 (model classes) and §7.1 (empirical distribution function).
  • UC Berkeley, STAT 210A: Statistical models and estimation, “Parametric vs nonparametric models,” on model indexing and remaining sampling assumptions.
Last updated
  • statistical models
  • nonparametric inference
  • empirical distribution
  • model risk
← Back to the glossaryBack to top ↑