How changing rates affect bond prices, reinvestment and funding, with exact five-year zero-coupon repricing and a duration comparison.
Interest rate risk
Interest rate risk is the exposure of a position's value, income or financing cost to changes in interest rates. For a fixed-payment bond, a higher required discount rate usually means a lower price today. A borrower whose debt resets to a floating rate can instead face higher future interest payments. The relevant loss depends on what is held, how it is funded and when cash is needed.
A fixed promised payment does not imply a fixed market value. That distinction is central to valuing bonds, managing collateral and matching assets to future liabilities.
The payment stays at USD 1,000
Consider a synthetic zero-coupon bond that pays USD 1,000 exactly five years from today, with no interim coupons or early-redemption option. Use an annual effective yield, and compare two valuations at the same instant. Hold the promised cash flow, currency and default assumptions unchanged; ignore trading costs and taxes.
The yield rise is one percentage point, or 100 basis points: Δy=0.01. Repricing from the unrounded values gives
ΔP=1.0551,000−1.0451,000≈−USD 38.40.
This is a 4.6721% fall in the initial price, not a reduction in the promised USD 1,000 repayment. It isolates discount-rate sensitivity; an actual market move could also reflect changes in credit spreads or liquidity.
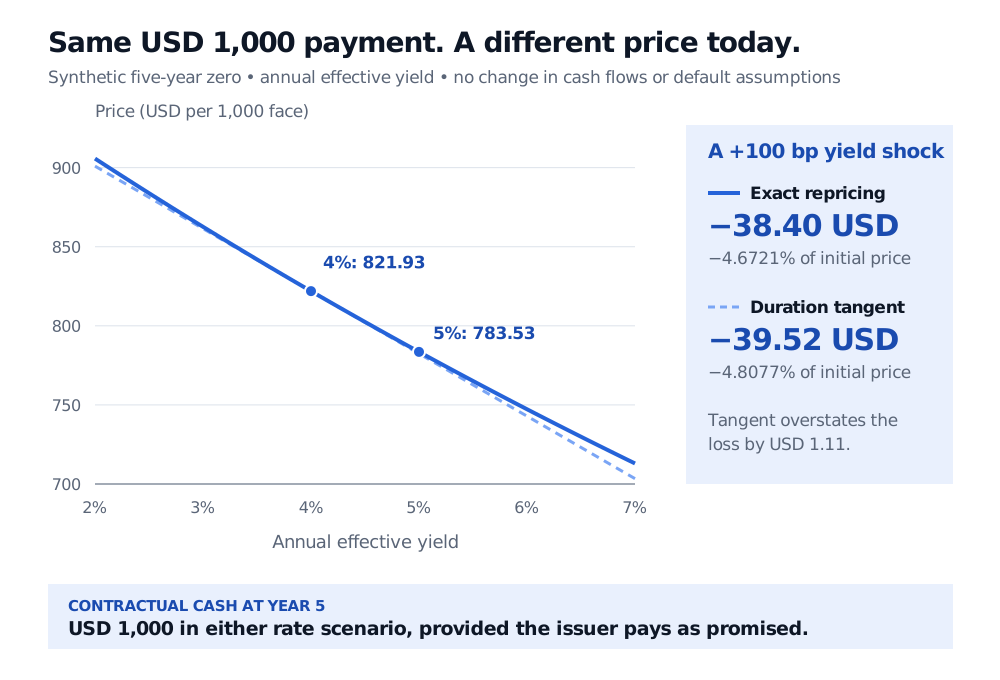
Five-year zero-coupon price sensitivity: a yield rise from 4% to 5% lowers price from USD 821.93 to USD 783.53, a USD 38.40 loss. The duration tangent predicts a USD 39.52 loss. The contractual payment remains USD 1,000 at year five.
Same cash flow, different present value. Original synthetic example; annual effective yields, with no change in default assumptions. Filled points mark exact prices; the dashed line is the local duration approximation.
The Bonds and Yields lesson develops this cash-flow pricing logic and separates yield to maturity from maturity-specific spot rates. Its preview is public; the full lesson requires membership.
Duration measures the local slope
Modified duration translates a small yield change into an approximate proportional price change:
PΔP≈−DmodΔy.
For this annual-effective five-year zero at a 4% yield,
Dmod=1.045≈4.807692.
Using the unrounded initial price and duration, the +100 bp shock therefore predicts
ΔPlinear=−1.0451,0001.045(0.01)≈−USD 39.52.
The local estimate is a 4.8077% price fall. Exact repricing gives a smaller loss: the tangent overstates it by about USD 1.11. The gap comes from the upward curvature of this fixed-payment price–yield relationship, measured by convexity. Duration is a derivative at the starting yield, not an exact rule for a finite shock.
For a fuller derivation, Duration and Convexity connects the slope to cash-flow timing and dollar sensitivity. The preview is public; full teaching requires membership.
A planned price–yield explorer would let readers vary the stipulated yield and compare prices for these fixed cash flows. It is not an available calculator here; the table, formula and figure provide the complete example.
Holding to maturity changes the question
If the issuer pays as promised, an investor holding this zero to maturity receives USD 1,000 under either rate scenario. There are no interim coupons to reinvest. A buyer who paid the initial price and receives that terminal payment earns the original 4% annual effective return over the full five years, before costs and taxes.
The lower mark still matters if the investor sells, posts the bond as collateral or measures assets against a liability that falls due earlier. Holding to maturity also leaves the purchasing power of the payment exposed to inflation. The contractual cash amount and its economic usefulness are different questions.
For a coupon bond, interest rates also determine what can be earned on payments received before the investor's horizon. Falling rates can raise the bond's current price while reducing subsequent coupon reinvestment income. Higher borrowing costs can offset investment income when a position is funded with floating-rate debt. Price risk, reinvestment risk and funding risk need separate cash-flow analysis.
Which rate moves, and what changes with it?
A single-yield example is deliberately narrow. A portfolio holds payments across the yield curve, whose short, middle and long maturities can move differently. A duration hedge calibrated to one common shift can retain exposure to a steepening, flattening or other change in curve shape. Different floating-rate indices can also move relative to one another, creating basis risk.
Cash flows may themselves respond to rates. An issuer's call right or a borrower's prepayment right can change when principal returns. Measuring that exposure requires a model of the contractual option and, where relevant, customer behaviour; a fixed-cash-flow duration calculation cannot supply it.
A useful risk report therefore states the curve or index being shocked, the bump convention, the cash-flow assumptions and the holding horizon. It compares small-shock sensitivities with full repricing under larger and differently shaped scenarios. Bonds, futures and swaps can offset specified exposures, but basis differences, nonlinear sensitivity, changing hedge ratios, funding and transaction costs remain. Matching one sensitivity is no universal hedge guarantee.
Sources
Frank J. Fabozzi and Francesco A. Fabozzi, Bond Markets, Analysis, and Strategies, 10th edition, MIT Press, 2021. Chapter 1, “Interest-Rate Risk” and “Reinvestment Income or Reinvestment Risk”; Chapter 4, “Duration,” “Properties of Duration” and “Approximating the Percentage Price Change.” Local PDF pages 33 and 120–127 inspected. These sections ground the price/cash-flow distinction and the local duration approximation; the numerical example above is original.