Calculate inflation from an original weighted basket, distinguish a price level from its growth rate, and see why slower inflation does not mean cheaper prices.
Inflation
Inflation is an increase in the general price level of goods and services over a stated period, usually expressed as a percentage change in a price index. Positive inflation means a given amount of money buys less of the measured basket. It does not require every price to rise. Consumer inflation is commonly measured using a consumer price index, or CPI. The RBA's measurement explainer explains the distinction between individual price changes and an aggregate basket.
A percentage needs a starting value and a time interval. If It is a price index, inflation from observation t−1 to observation t is
πt=It−1It−It−1.
Here πt is a decimal; multiply by 100 to express it as a percentage. A year-on-year rate compares observations one year apart. A monthly percentage change and a twelve-month percentage change answer different questions; neither is just the index level itself.
The same basket can get dearer while energy gets cheaper
Nora is setting aside money for a repeat monthly spending plan. She wants to know how much cash would buy exactly the same quantities and quality at three dates, each one year apart. Her deliberately small, fictional basket contains 20 food units, 10 energy units and one month of rent. The units, prices and spending weights are teaching assumptions, not an actual household survey, official CPI basket or forecast.
All unit prices below are in USD. The quantities stay fixed in every column.
Item
Fixed quantity
Year 0 unit price
Year 1 unit price
Year 2 unit price
Food
20 units
5.00
6.00
6.30
Energy
10 units
4.00
3.00
3.20
Rent
1 month
600.00
630.00
642.00
Cost of whole basket
740.00 USD
780.00 USD
800.00 USD
For example, the starting cost is 20(5)+10(4)+600=740 USD. The next year's cost is 20(6)+10(3)+630=780 USD. Nora needs 40 USD more to repeat this spending plan:
π1=740780−740=0.054054…≈5.41%.
An unchanged fictional monthly basket rises from 740 to 780 USD: food adds 20 USD, energy subtracts 10 USD and rent adds 30 USD, giving a net 40 USD increase and 5.41% inflation.
Original fixed-quantity teaching example, not official CPI data. Dollar contributions depend on quantities and price changes; falling energy prices only partly offset the other increases.
Food rose by 20%, energy fell by 25%, and rent rose by 5%. Their simple average is zero. That would give the wrong answer for this basket because Nora initially spends far more on rent than on energy. The correct starting expenditure weights are 100/740, 40/740 and 600/740:
π1=740100(20%)+74040(−25%)+740600(5%)≈5.41%.
The weights multiply percentage changes; quantities alone are not expenditure weights. Equivalently, the first figure adds the dollar effects: 20−10+30=40 USD. Both calculations describe the same fixed basket.
Slower inflation still leaves a larger bill
In Year 2 the basket costs 800 USD. The increase is now measured against 780, the previous year's cost:
π2=780800−780=0.025641…≈2.56%.
Inflation slowed from 5.41% to 2.56%, yet Nora needs another 20 USD. This is disinflation: the inflation rate declines. Deflation would mean the general price level falls, giving a negative inflation rate. Zero inflation would leave it unchanged over the measured interval.
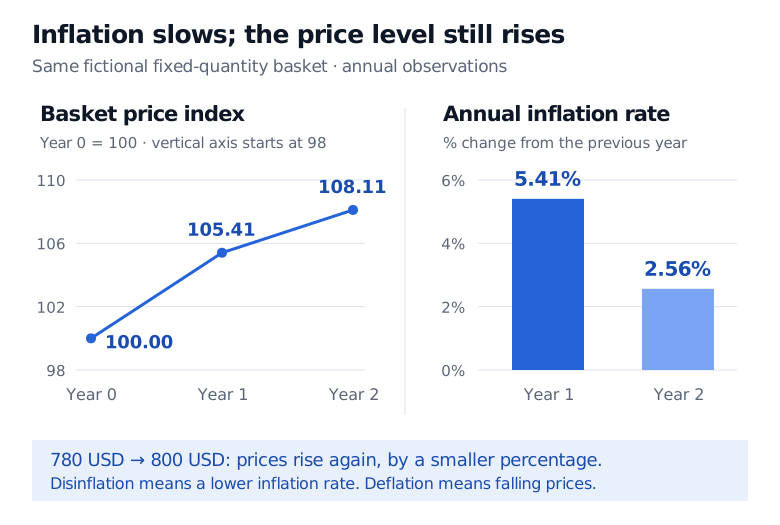
To show the distinction, turn each basket cost Ct into an index with It=100Ct/C0. The levels are 100, 105.41 and 108.11, using unrounded calculations. Year 2 prices are 8.11% above Year 0, even though the latest annual inflation rate is only 2.56%.
Separate panels show the fictional basket index increasing from 100 to 105.41 to 108.11 while annual inflation slows from 5.41% to 2.56%. The index axis starts at 98; the rate axis starts at zero.
A lower positive inflation rate still raises the price level. Lines join annual observations of the same fictional basket; there is no forecast or assumed within-year path.
What a published inflation number can tell you
The small basket isolates the arithmetic. An official index also needs a defined population and coverage, statistical sampling and expenditure weights, treatment of quality changes, and rules for updating or replacing items. Statistical agencies use methods that go beyond keeping this three-item basket unchanged forever. The BLS CPI FAQ explains why the resulting average need not match a particular household's inflation experience.
Before comparing two reported numbers, check the index, geography, comparison period and seasonal-adjustment basis. A change from one month to the next cannot be compared directly with a change from the same month a year earlier. A movement in a single commodity price is also insufficient to identify the change in the broad consumer basket.
For finance, the distinction is between money received and what it can purchase. A nominal interest rate describes money growth under its stated convention; a real interest rate adjusts for inflation over a matching period. Nora's price history measures what happened. Using inflation in a future spending or investment calculation requires an assumption about inflation expectations; an observed past rate does not fix next year's prices.
Practice: which denominator?
Question. A fictional price index is 100 at the start, 104 one year later and 106 after a second year. What is inflation during the second year, and have prices fallen?
A. 2.00%, and prices have risen.
B. About 1.92%, and prices have risen.
C. About 1.92%, and prices have fallen because inflation slowed.
D. 6.00%, and prices have risen.
Answer.B. The second year's rate is (106−104)/104×100%=1.923076…%, approximately 1.92%. The index rises from 104 to 106, so prices rise. First-year inflation was 4%; the lower second-year rate shows disinflation. A confuses the increase of two index points with a percentage increase on 104. C confuses a falling rate with a falling level. D is the cumulative price increase across both years, measured from 100.