The F-distribution compares independent scaled chi-squared variables. Understand variance ratios, ordered degrees of freedom and a P&L example where test direction changes the conclusion.
F-distribution
The F-distribution is the probability distribution of a ratio of two independent chi-squared variables, each divided by its own degrees of freedom. It is a reference law for comparing estimated variances and for testing restrictions in normal linear models. A ratio is not F-distributed merely because both its numerator and denominator measure variation.
The two parameters are ordered: d1 belongs to the numerator, d2 to the denominator. The chi-squared distribution explains the building blocks; the F law explains their relative size. Since both scaled quantities are dimensionless, so is W.
Why dividing by an estimate creates a long right tail
Each scaled chi-squared variable has mean one. Their ratio nevertheless does not generally have mean one: a small random denominator can produce a very large ratio. In particular, the expectation of a ratio is not the ratio of expectations.
Here Γ is the gamma function. The variable is positive with probability one, has no point mass at zero, and has an unbounded right tail. Positive real degree parameters define the family; the interpretation as literal counts of independent squared standard normals applies to positive integers.
These are existence conditions, not suggestions about sample size. The mean diverges for d2≤2; a finite variance requires d2>4. For F5,10, the mean is 1.25 and the variance is 65/48≈1.354167. Even under equal population variances, the expected sample-variance ratio can exceed one. The NIST F-distribution reference gives these distributional properties.
Two hedging rules, a fourfold variance ratio
Consider an original synthetic comparison of one-period P&L from two hedging rules, each applied to the same position size. Rule A has 6 observations; rule B has 11. Assume each sample is iid normal, the samples are independent of each other, and both population means are unknown. Independence could be imposed in a simulator through independent scenario streams; it should not be presumed for two rules exposed to the same market days.
Using the sample variance around each sample's own mean, with divisor ni−1, suppose the observations give:
Quantity
Rule A
Rule B
Sample size
6
11
Sample variance
0.04USD2
0.01USD2
Sample standard deviation
USD 0.20
USD 0.10
Residual degrees of freedom
5
10
Before observing the samples, the team specifies the null hypothesis H0:σA2=σB2 and the upper-sided alternative H1:σA2>σB2.
Normal-sample variance theory gives independent variables
U=σA25SA2∼χ52,V=σB210SB2∼χ102.
Under the null, the common population variance cancels:
V/10U/5=SB2SA2∼F5,10,wobserved=0.010.04=4.
Both the USD-squared units and the degrees-of-freedom factors cancel in the statistic. Do not multiply the sample-variance ratio by 10/5 again. The 5 and 10 still determine its reference distribution.
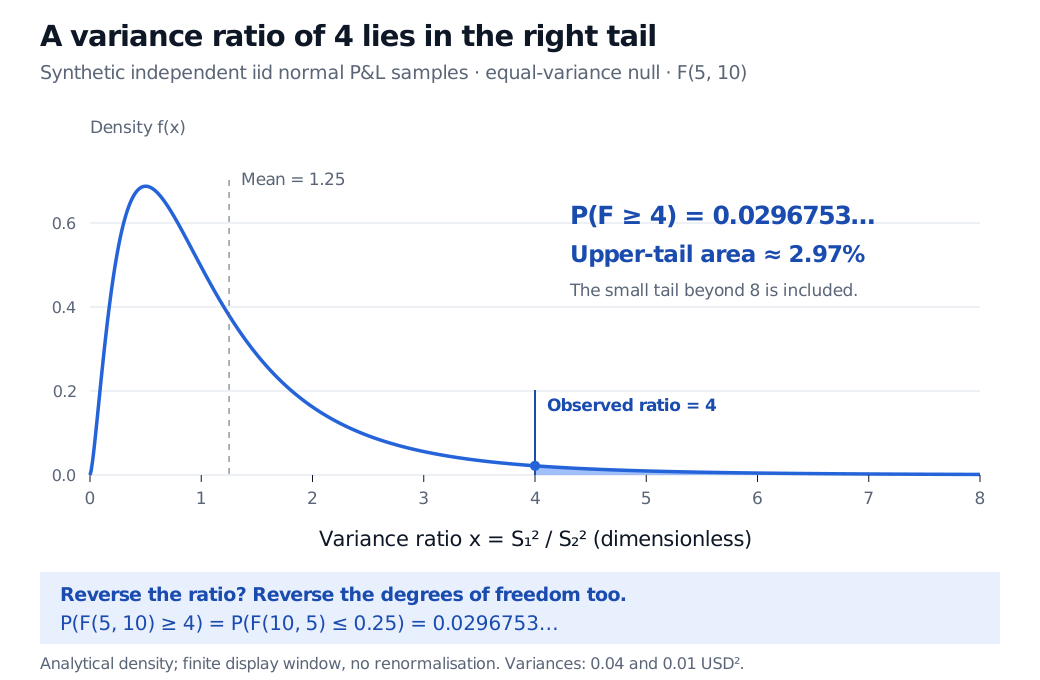
Synthetic independent iid normal P&L samples give sample variances 0.04 and 0.01 USD squared, an observed ratio of 4 and an F distribution with numerator 5 and denominator 10 degrees of freedom. The mean is 1.25. The shaded right-tail probability beyond 4 is 0.0296753, about 2.97%. Reversing the ratio gives 0.25 with degrees of freedom 10 and 5 and the same lower-tail probability.
Original analytical plot for the synthetic equal-variance null. The shaded probability includes the tail beyond the displayed range; the density is not renormalised. The blue dot marks the attained density value at the observed statistic.
At a prespecified 5% significance level, the upper-sided test rejects equal variances in the direction of higher variance for A. It does not say there is a 97.03% probability that A's population variance is higher. The probability describes repeated sampling under the null model, not uncertainty about which hypothesis is true.
The question's direction matters. For an equal-tail two-sided test of unequal variances, the p-value here is
2min{P(F5,10≤4),P(F5,10≥4)}=0.0593505904….
That test does not reject at 5%. Choosing the upper-sided question after seeing that A has the larger sample variance changes the procedure; it does not preserve the advertised one-sided error rate. NIST distinguishes the upper, lower and two-sided variance tests.
Keep the order; check the model
Taking the reciprocal swaps the degree parameters:
W∼Fd1,d2⟹W1∼Fd2,d1.
Thus P(F5,10≥4)=P(F10,5≤0.25). Reversing the ratio while keeping F5,10 would answer the wrong question. More generally, when population variances differ, the normalised ratio
SB2/σB2SA2/σA2∼F5,10
still has the F law under the stated sampling assumptions. The raw sample-variance ratio then has an additional population-variance scale factor.
An observed fourfold variance ratio means a twofold sample standard-deviation ratio, not fourfold volatility. Nor does the exact calculation automatically carry over to heavy-tailed, serially dependent or changing-volatility market P&L. A large sample alone does not make the unadjusted normal-theory variance-ratio test valid. The variance comparison also says nothing directly about mean returns or hedge bias.
The same central family appears in linear regression, where independent normal-model sums of squares compare explained variation with residual noise under the null. A useful link is T2∼F1,ν when T has a central Student's t-distribution with ν degrees of freedom. Squaring discards the sign, so this F test corresponds to a two-sided t test. Regression F statistics under alternatives can instead have a noncentral F law; “F statistic” does not guarantee the central null distribution everywhere.
John A. Rice, Mathematical Statistics and Data Analysis, 3rd ed., §6.2, definition and Proposition B, and §6.3, Theorem B — F construction, density, t-squared relationship and normal-sample variance law.