For a scalar, Brownian-driven model, the usual Itô notation is
What the differential notation means
The defining statement is an integral equation:
Brownian paths have no ordinary time derivative. Consequently, dividing the equation by does not produce a conventional differential equation with an ordinary random slope . Nor can the stochastic integral silently be replaced by a Stratonovich integral: when diffusion depends on the state, changing conventions generally requires a drift correction to describe the same process.
Even when is a known deterministic function, can be random because is random. “Drift” describes the local conditional direction of movement, rather than a guaranteed deterministic trajectory.
A cash-balance model you can calculate exactly
Suppose a synthetic cash balance, measured in USD, follows
with time measured in years. This additive model is arithmetic Brownian motion. The coefficient 2 has units USD/year. Because Brownian increments have standard deviation over years, the coefficient 3 has units USD/. The resulting variance rate is 9 USD²/year. These units prevent a common simulation mistake: noise scales with the square root of elapsed time, while the drift contribution scales with elapsed time itself.
The coefficients are constant, so integrating gives the exact transition
where is independent of information at . At , take year and specify a shock . Then
Before observing the shock, the quarter-year endpoint has mean USD 100.50 and standard deviation USD 1.50:
The second parameter here is the variance in USD². USD 102 is one selected endpoint, one standard deviation above the mean; it is not the expected balance.
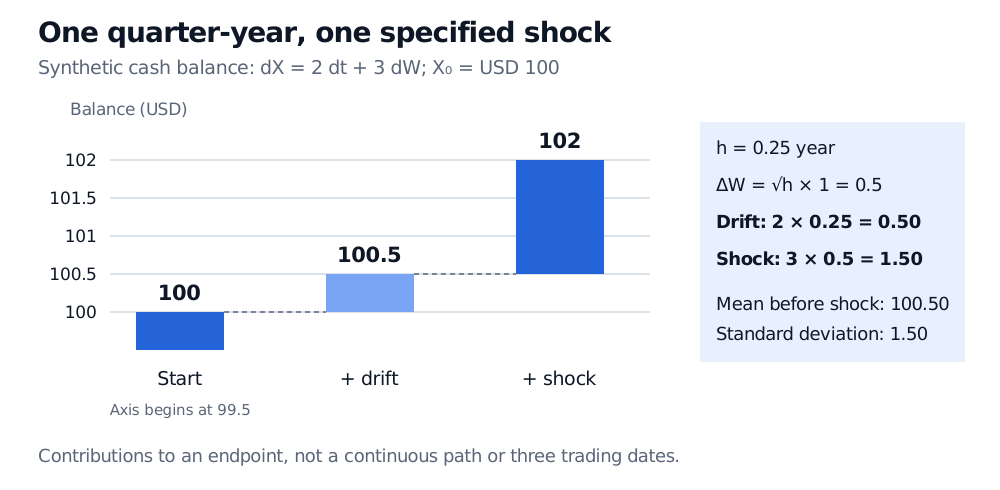
This can be a simple model for cash that may move into borrowing. It would be unsuitable for an asset price that must stay positive: its normal transition distribution allows negative balances. That is a property of the assumed model, not a numerical failure.
The SDE and its simulation scheme are different objects
A general SDE rarely integrates as simply. The Euler–Maruyama method freezes the coefficients at the start of each step:
Set , per year, per square-root year, and use the same , . Euler gives
The exact GBM transition instead gives
The difference is about USD 0.1873 for this shock and step. Both calculations use the same Brownian increment; the discrepancy comes from the approximation rule. It is not evidence of a different shock, an estimated market error or a universal direction of pricing bias.
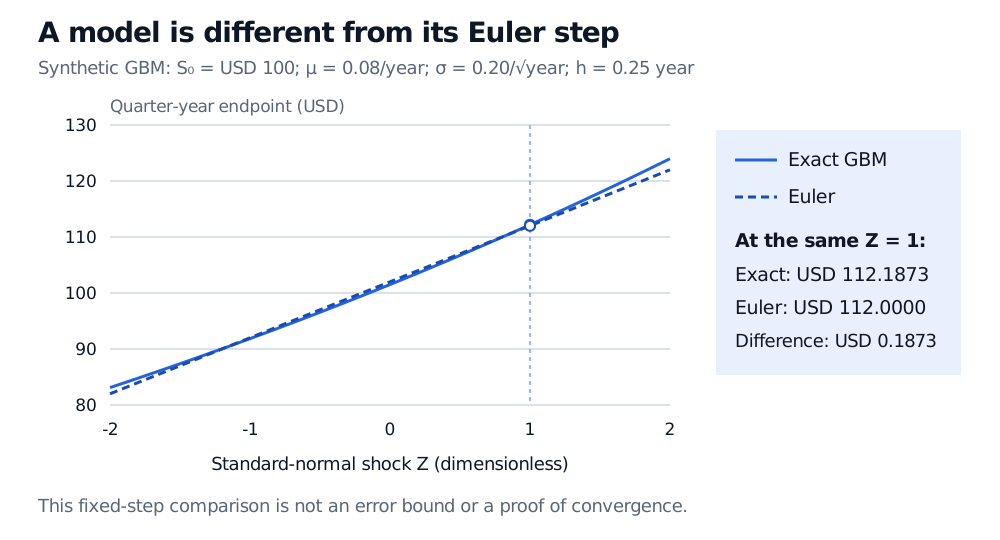
An exact transition samples the model correctly at the chosen dates. It still does not reveal every movement between those dates. For a barrier payoff, missing an intervening crossing can matter even when the endpoint samples are exact.
Before trusting the model
Writing an SDE does not establish that a solution exists or is unique. A standard sufficient result uses coefficients that are globally Lipschitz in the state, with at most linear growth, on a finite horizon, plus suitable measurability and an initial condition with finite second moment. It yields a unique adapted strong solution driven by the given Brownian motion. These conditions are sufficient rather than necessary; square-root diffusions require more specialised analysis.
Existence of a solution also does not guarantee that a chosen numerical scheme behaves well. Convergence, stability, boundary behaviour and the payoff being estimated need their own checks. For simulation comparisons, use common Brownian increments so a change of random input does not obscure discretisation error.
Finally, the probability measure belongs to the specification. A drift chosen for real-world scenario generation need not equal the drift under a risk-neutral measure. A syntactically correct SDE, or an accurate solver, cannot by itself justify a pricing assumption or establish that a model fits financial data.
Sources
- John C. Hull, Options, Futures, and Other Derivatives, 9th Global Edition, Chapter 14 §§14.2–14.3 and §14.6: generalised Wiener processes, state-dependent coefficients, stock-price dynamics and Itô's lemma.
- Desmond J. Higham, “An Algorithmic Introduction to Numerical Simulation of Stochastic Differential Equations,” SIAM Review 43(3), 2001, §§3–5 and §7: integral conventions, Euler–Maruyama, exact GBM comparison, convergence and stability.
- MIT OpenCourseWare, 18.S096, Fall 2013, Lecture 21, §1, Theorem 1.1 and §1.1: sufficient existence and uniqueness conditions and the GBM solution.