Spread per turn of leverage divides an instrument’s credit spread by a borrower leverage multiple, commonly debt divided by EBITDA. A turn is one unit of that multiple. The ratio gives credit analysts a quick way to compare how much quoted spread similar bonds or loans offer relative to borrower indebtedness. Invesco, for example, uses it alongside structural and credit analysis when comparing corporate hybrid bonds. Invesco, “Relative value”
A ranking can turn on the debt definition
Take two fictional senior unsecured bonds in the same currency and sector, with similar maturities. Their option-adjusted spreads (OAS) are measured on the same date using the same benchmark curve and model conventions. Bond A’s issuer has USD 450 million of gross debt and USD 100 million of trailing 12-month EBITDA. Its gross leverage is 4.5×. With an OAS of 450 basis points, the screen reads
For gross leverage, use debt before subtracting cash. For net leverage, subtract cash that qualifies under the chosen definition, then divide by the same EBITDA. Some borrowers report both. A Merrill Lynch chartbook uses OAS divided by net debt to trailing 12-month EBITDA for its bond comparisons. Peloton, gross and net leverage reconciliation, Merrill Lynch, GIC Chartbook, glossary
| Bond | OAS | Gross debt (USD m) | Eligible cash (USD m) | Trailing EBITDA (USD m) | Gross leverage | Net leverage |
|---|---|---|---|---|---|---|
| A | 450 bp | 450 | 50 | 100 | 4.5× | 4.0× |
| B | 420 bp | 500 | 200 | 100 | 5.0× | 3.0× |
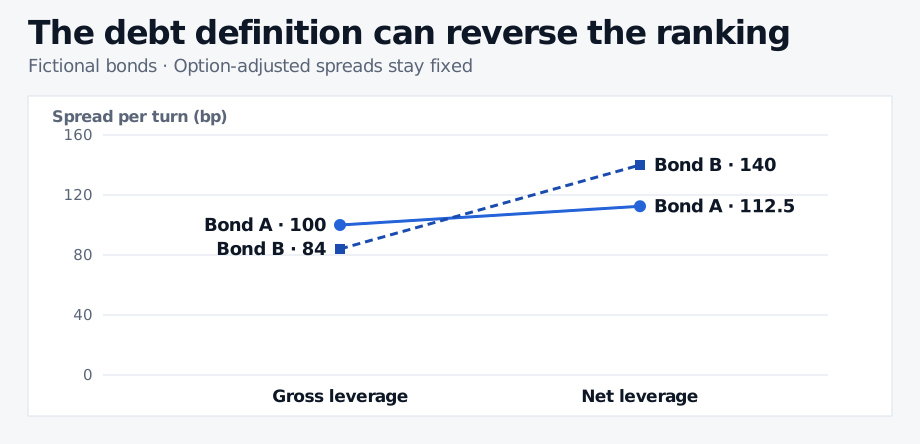
Subtracting eligible cash reduces B’s measured leverage by more than A’s, reversing the ranking at the same quoted spreads.
What makes the inputs comparable?
- Use one spread convention. For bonds, compare the same spread measure, benchmark, currency and observation date. For floating-rate leveraged loans or direct loans, the numerator can be the contractual margin over a reference rate. Compare margins with margins and check how the quote treats fees, original issue discount and rate floors. Keep the sign of the quoted spread. With positive leverage, a negative spread gives a negative reading and a zero spread gives zero.
- Match the debt perimeter and the earnings period. Choose total debt or a defined slice such as first-lien debt. Apply the same gross or net convention, cash eligibility, EBITDA period and rules for add-backs. Align the available financial data with the pricing date. TPG Twin Brook’s May 2026 filing, for example, describes a first-lien loan comparison that pairs first-lien spreads with first-lien leverage. TPG Twin Brook, Form 8-K, Item 7.01, note 27
- Screen only where leverage is meaningful. Zero EBITDA leaves debt to EBITDA undefined. Negative EBITDA can turn the leverage multiple negative even when the borrower owes substantial debt. Skip this ranking for either case. With positive EBITDA, zero leverage makes the final ratio undefined and near-zero leverage makes it unstable. A net-cash balance can also put net leverage below zero, outside the ordinary positive-leverage ranking.
The screen compares spread with one borrower characteristic. Differences in maturity, liquidity, collateral, seniority and covenants can still explain a higher reading. The SelfMadeQuant lesson Credit-Sensitive Bonds explains how claim rank affects recovery in its capital structure section (full lesson for members).
The ratio divides two current levels. To estimate how a bond would reprice if its issuer added another turn, you would need a separate model of how borrowing changes its credit and the market’s pricing of that credit. Estimating expected default loss takes a horizon, a default probability and loss given default. A quoted spread can also reflect investors’ risk appetite. Federal Reserve, “The excess bond premium”
For price sensitivity to a proportional spread move, use Duration Times Spread, which multiplies spread by spread duration.
Sources
- Invesco, The corporate hybrid: Expanding market offers opportunities, “How do we analyse corporate hybrids?” §3.
- Merrill Lynch, Global Institutional Consulting Chartbook, January 2018, credit analysis and glossary.
- Peloton, fiscal Q2 2026 results, “Gross Principal Debt Outstanding, Net of Cash and cash equivalents, Gross Leverage Ratio, and Net Leverage Ratio”.
- TPG Twin Brook Capital Income Fund, Form 8-K, 21 May 2026, Item 7.01 and note 27.
- Favara, Gilchrist, Lewis and Zakrajšek, Recession Risk and the Excess Bond Premium, Federal Reserve, 2016.