A yield-curve inversion means longer yields are below shorter yields on a specified segment. See an exact forward-rate replication and why recession forecasts need more than a negative spread.
Inverted yield curve
An inverted yield curve is a yield curve on which longer maturities have lower yields than shorter maturities over a stated segment. For a rates analyst, the immediate consequence is a negative long-minus-short yield spread. It changes the price of locking in future funding; it does not, by itself, identify tomorrow's policy rate or the next recession.
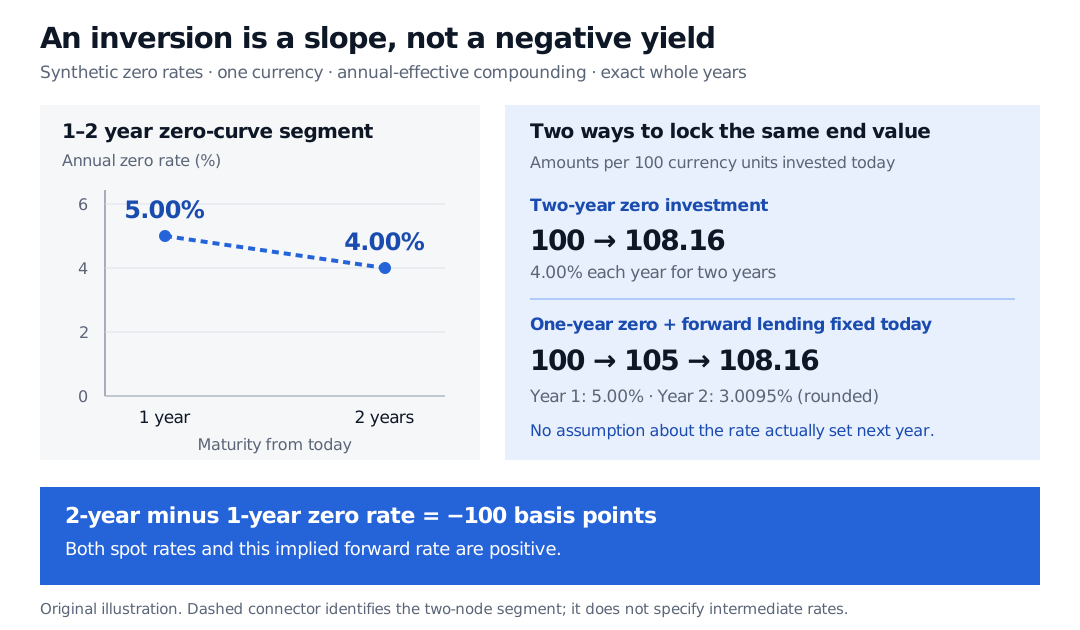
“Inverted” describes the slope, not the sign of the yields. A curve falling from 5% to 4% is inverted even though both yields are positive.
First specify what is inverted
A useful statement names the currency, the instruments or curve family, the date and the maturity pair. “The US Treasury 2s10s spread is negative” normally means the 10-year Treasury yield minus the 2-year Treasury yield is below zero. A 10-year minus 3-month Treasury spread is a different measure. One can be negative while another is positive.
The same discipline applies to the rate representation. Zero (spot) rates, par yields and individual bonds' yields to maturity are related but distinct. Comparing a bank deposit rate with a corporate bond yield also mixes credit and liquidity effects with maturity. Compare like with like before interpreting the slope, and do not describe an entire curve as falling merely because two selected points are inverted.
What the inversion prices
Take a synthetic one-currency zero curve, observed today, with a one-year spot rate of 5% and a two-year spot rate of 4%. Both rates use annual-effective compounding, with cash flows at exact whole-year dates. Assume one default-free pricing framework, frictionless trading and the ability to borrow and lend at the stated prices. These are illustrative conventions, not market quotes.
The two-year minus one-year spread is 4%−5%=−1 percentage point, or −100 basis points. Investing 100 currency units for two years produces 100(1.04)2=108.16. Investing for one year produces 105; a second year at the same 5% is not available merely because today's one-year rate is 5%.
The lower second-year forward makes the two-year annualised rate lower than the first-year rate. It is a contractual break-even rate implied by today's prices, not a requirement that next year's observed one-year spot rate equal 3.0095%.
Synthetic annual-effective zero curve with a one-year rate of 5% and two-year rate of 4%, a spread of minus 100 basis points. Both rates are positive. Investing 100 for two years yields 108.16. A one-year investment reaches 105; forward lending fixed today at 3.0095% for the following year reaches the same 108.16.
Original synthetic illustration. One currency and annual-effective compounding. The dashed segment joins only the two specified zero rates. The second investment path locks the future lending rate today; it does not assume a future rate forecast comes true.
The cash flows explain why this rate is fixed by no-arbitrage. The discount factors, the prices today of one unit paid at each date, are D1=1/1.05=20/21 and D2=1/(1.04)2=625/676.
To replicate lending 100 at year 1, buy a two-year zero-coupon payment of 100D1/D2=103.0095238… and finance it by shorting a one-year zero-coupon payment of 100:
Position
Today
Year 1
Year 2
Buy the two-year payment
−95.238095
0
+103.009524
Short the one-year payment
+95.238095
−100
0
Net
0
−100
+103.009524
Amounts in currency units, rounded to six decimals; the initial costs offset exactly before rounding.
The net position is forward lending: pay 100 next year and receive about 103.0095 the year after. The return is positive even though the spot-curve segment is inverted. If a forward loan on identical terms had a different rate, taking opposite sides of the loan and this replication would leave a riskless surplus in the assumed frictionless framework.
For the practical step before this calculation, Bootstrapping the Spot Curve from Market Instruments explains how quoted instruments supply discount factors. Its preview is public; the full lesson requires membership.
Why a recession interpretation needs more than the sign
An inversion can be consistent with investors expecting future policy easing, perhaps as growth and inflation weaken. The RBA's explainer describes this channel and the historical association between inversions and later contractions in some countries. That is an economic interpretation of a price pattern, distinct from the replication above.
Longer yields also embed a term premium. Lower or negative premiums can pull long yields down even without an equally large change in expected short rates. The Federal Reserve's term-structure model documentation explicitly allows interest-rate risk premiums of either sign and warns that extracting expectations is model-dependent. Treating every forward rate as an unbiased forecast requires assumptions such as the expectations hypothesis; the curve alone does not establish them.
In US research, the Treasury slope has contained information about subsequent economic activity. Estrella's 2005 New York Fed FAQ discusses the evidence and its dependence on the chosen spread, sample and forecasting model. It is historical research, not a current recession call. An inversion supplies neither a guaranteed recession nor a fixed countdown to one.
The practical distinction is between measurement, pricing and forecasting: identify the inverted segment, use a consistent curve to price its implied forwards, then state the model and evidence behind any economic forecast. A negative spread alone completes only the first step.
Sources
John C. Hull, Options, Futures, and Other Derivatives, ninth Global Edition, Pearson, 2018: §4.6, pp. 108–109, on forward rates and replication; §4.10, pp. 118–119, on competing theories of the term structure. The worked example here uses annual-effective compounding rather than Hull's continuous-compounding example.
Reserve Bank of Australia, Bonds and the Yield Curve: curve shapes, policy expectations and economic interpretation.