Count labelled items in a finite sample without replacement, calculate an audit detection probability, and understand dependence and the finite population correction.
Hypergeometric distribution
The hypergeometric distribution gives the number of items with a specified label in a uniform random sample drawn without replacement from a finite population whose label counts are fixed. It answers questions such as: if an order-audit pool contains a known number of flagged records, how likely is a random inspection to include at least one?
The randomness is in which records are sampled. The labels in the pool are already fixed. This is a different experiment from generating new, independent flags with a constant probability on each trial.
Count the samples, not independent successes
Let N be the population size, K the number of labelled items and n the sample size. Assume integers N≥1, 0≤K≤N and 0≤n≤N. If every n-item subset is equally likely and X counts labelled items in the sample, write
for integer x, and zero elsewhere. The denominator counts all samples; the numerator chooses x labelled items and n−x unlabelled items. No ordering factor is needed: both counts concern unordered subsets. The Counting and Combinatorics lesson develops this subset interpretation of the binomial coefficient; the public page is a preview and the full lesson requires membership.
The support has two constraints that are easy to miss. You cannot draw more than K labelled items, and you cannot draw more than N−K unlabelled items. For example, with 20 records and 5 flags, a sample of 17 must contain at least 2 flags: only 15 unflagged records exist. The support is then 2,3,4,5, rather than every count from zero to 17. Penn State's STAT 414 notes introduce the law through the same two-category sampling structure.
A four-order inspection
Consider a synthetic audit-design scenario: a frozen pool has 20 order records, exactly 5 of which carry a particular surveillance flag. Select 4 distinct records uniformly at random. A flag is a label for inspection, not proof of a trading violation. We condition on the stipulated pool composition; we are not estimating how many flags exist.
There are (420)=4,845 possible samples. A clean sweep of four unflagged records occurs in (415)=1,365 of them, so
P(X=0)=(420)(415)=32391≈0.281734.
Using the complement rule, the probability of finding at least one flag is
P(X≥1)=1−32391=323232≈71.8266%.
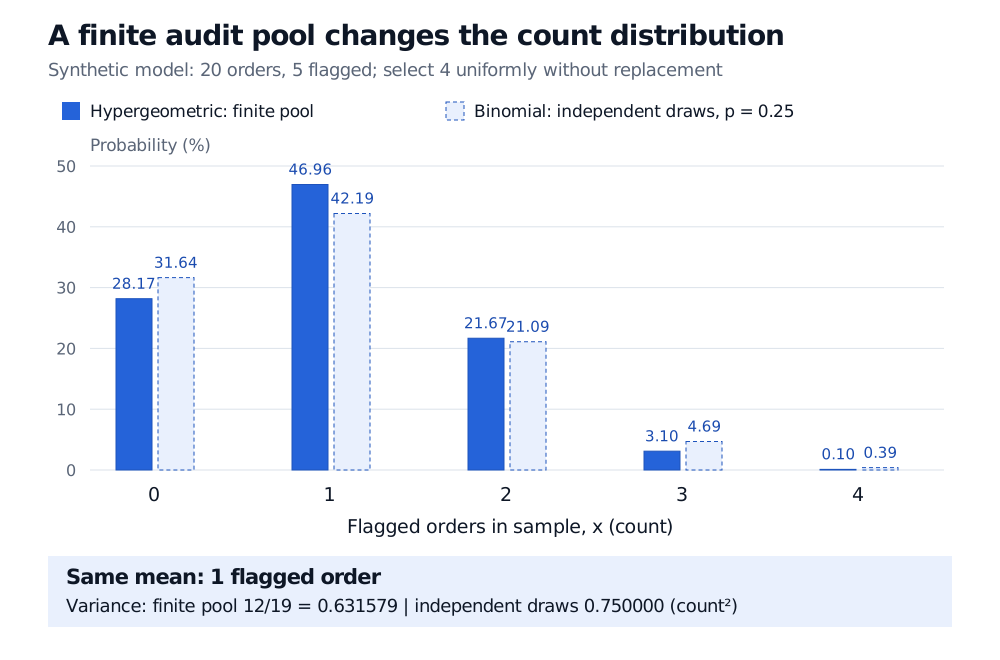
The whole distribution shows what that detection probability contains:
Flags in sample, x
Samples with this count
Probability
0
1,365
28.1734%
1
2,275
46.9556%
2
1,050
21.6718%
3
150
3.0960%
4
5
0.1032%
Percentages are rounded individually. A mean count of one does not mean every inspection finds one: both zero and multiple flags have positive probability.
Paired probability bars compare a synthetic hypergeometric sample of 4 orders from 20 with 5 flags against four independent draws with flag probability 0.25. Both means are 1. Finite-pool variance is 0.631579 count squared versus 0.75 for independent draws; zero-flag probabilities are 28.17% and 31.64%.
Original synthetic sampling model. Solid bars use a fixed pool without replacement; outlined bars use independent binomial trials with the same marginal flag probability. The plotted distribution is a count of labels, not a distribution of financial losses.
Equal marginal probabilities, dependent draws
Before looking at any results, each draw position has flag probability 5/20=1/4. Yet observing the first draw changes the composition left for the second:
Neither conditional probability equals 1/4. Thus the flag indicators are identically distributed across draw positions but lack independence. The Conditional Probability lesson, available as a public preview with full text for members, builds the multiplication rule used here. For example, the zero-flag probability can also be calculated sequentially as
2015191418131712=32391.
Let p=K/N. The expected value is E[X]=np, because expectation adds the n indicator means even when the indicators are dependent. For N>1, the variance is
Var(X)=np(1−p)N−1N−n.
The factor (N−n)/(N−1) is the finite population correction to the binomial variance. For standard deviation, take its square root. In our example,
The units are flagged-order counts for the mean and squared counts for variance. To see why dispersion falls, let Ii indicate a labelled item at draw position i. For distinct positions in a sample of at least two items,
Cov(Ii,Ij)=−N−1p(1−p).
Drawing one labelled item depletes the supply available for the others. Summing n individual variances and n(n−1) ordered covariance terms gives the correction. When the entire population is sampled, n=N and X=K with certainty. For N=1, handle the single-item population directly: every allowed sample count is deterministic, so variance is zero rather than an undefined 0/0 calculation.
When a binomial approximation changes the answer
A binomial distribution with parameters n and p=K/N has the same mean but assumes independent trials. In this example it gives variance 4(1/4)(3/4)=0.75 and
Pbinomial(X≥1)=1−(43)4=256175≈68.3594%.
That is below the exact finite-pool detection probability of 71.8266%. Lower variance does not mean every tail probability falls; here zero flags becomes less likely, raising the probability of at least one.
For fixed n, as N grows and K/N approaches a fixed proportion, the hypergeometric law approaches the corresponding binomial law. In practical approximation work, inspect the sample fraction and the event being calculated. A small variance correction alone does not certify accurate relative probabilities for a rare event or for counts near a finite-support boundary.
Uniform selection is essential. A risk-weighted audit that deliberately oversamples suspicious orders does not generally follow this law. Nor does a portfolio's future default count become hypergeometric merely because there are finitely many names: future labels may be random, heterogeneous and dependent through economic conditions. If K is unknown, the formula is conditional on each proposed K; inference about K requires an additional statistical argument.
For software calculations, verify the parameter convention. In R's official hypergeometric documentation, m and n are the labelled and unlabelled population counts, while k is the sample size. Its upper-tail option returns a strict exceedance probability, so the threshold must reflect whether the question says “more than” or “at least.”
Sources
Sheldon M. Ross, A First Course in Probability, 10th edition, §4.8.3, “The Hypergeometric Random Variable,” especially equation (8.4) and Example 8j; sampling-without-replacement law, binomial approximation and moments.