Comparable company analysis, often called trading comps, estimates a target company’s value from the multiples at which similar public companies trade. An analyst measures what the market pays per unit of earnings, sales or another financial metric for each peer, then applies a peer benchmark to the target’s corresponding metric. The result can anchor an equity valuation to current market prices. It also inherits the market’s pricing of the peer group. Damodaran, The Anatomy of a Multiple
What makes a company comparable?
Start with firms that earn money in similar ways. Two machinery companies might share an industry code, but one mainly sells equipment and the other rents out a fleet it must keep replacing. Even with similar EBITDA margins, their reinvestment needs and cash generation can differ. Compare business mix, expected growth, margins, reinvestment and operating risk before pooling their multiples. Record why each peer belongs. The median limits the influence of one extreme observation, but it still reflects the companies you selected. Damodaran, The Anatomy of a Multiple, Pricing, slides 47–51
Match the numerator and denominator to the same claims and operations. Enterprise value (EV) represents the value of the operating business, so pair it with operating EBITDA, or earnings before interest, taxes, depreciation and amortisation. The price-to-earnings ratio instead pairs market capitalisation with earnings attributable to common shareholders. If EBITDA includes all of a consolidated subsidiary’s earnings, EV must also include the value of the subsidiary stake held by outside shareholders. Apply consistent lease treatment and reconcile adjustments to reported results. An expense that recurs across reporting periods can still matter even when management adds it back. Damodaran, Financial Measures and Ratios, Pricing, slides 8–11 and 47
Fix a valuation date and use share prices, balance-sheet information and forecasts available by that cutoff. Build the denominator on a consistent horizon for peers and target, such as the latest twelve reported months or the same forecast twelve-month window. Different fiscal year-ends can make two estimates labelled “next fiscal year” cover different months. Align their forecast periods and keep the vintage of each estimate. A quarter-end identifies the period measured. Using results before their release introduces look-ahead bias. Atkore’s merger proxy supplement shows how its adviser aligned peer EBITDA forecasts to a common fiscal year-end. Atkore, Merger Proxy Supplement, Public Trading Multiples
From 10× EBITDA to common equity
Three fictional peers trade at 8×, 10× and 14× EV to normalised trailing EBITDA. All use the same valuation date, trailing reporting window and adjustment policy. The target has 25 million USD of EBITDA on that basis. The market value of its debt is 80 million and the bridge adds back 20 million of non-operating cash. There are no other claims or non-operating assets in this example.
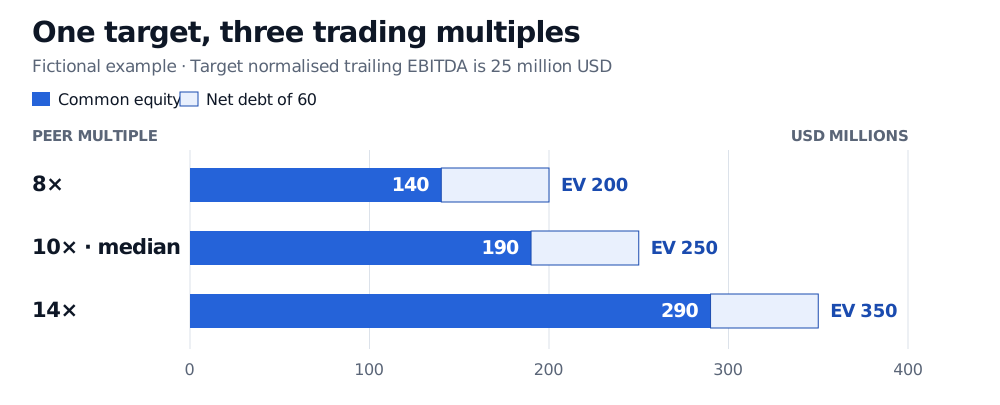
Each bar ends at implied enterprise value. The same net debt reduces the amount attributable to common shareholders in every scenario.
The endpoints show what the observed multiples imply for the same target. Read the spread as sensitivity to the selected multiple. All three estimates could move together if the market repriced the sector. In a fuller bridge, subtract other claims included in EV, such as preferred stock and non-controlling interests, and add back any non-operating assets excluded from EV. Damodaran, Financial Measures and Ratios
When EBITDA stops helping
With positive EV, a near-zero positive EBITDA produces a very large multiple. Zero EBITDA makes the ratio undefined, and negative EBITDA produces a negative ratio that cannot be ranked alongside positive multiples as a measure of cheapness. Flag those peers and report how the exclusions change the group. For a loss-making target with positive revenue, EV/revenue may offer a benchmark if peers have comparable prospects for turning sales into cash. If that comparison is weak too, a discounted cash flow valuation can make the expected path to profitability explicit. Damodaran, Pricing, slides 47–52, Duff & Phelps, AirMedia Fairness Opinion Presentation, p. 15
Trading comps use quoted prices for public peers. Precedent transaction analysis uses prices agreed in earlier deals. Keep those benchmarks separate because the deal price reflects the transaction terms and the market at the time. Atkore, Merger Proxy Supplement, Public Trading Multiples and Selected Transactions Analysis
The SelfMadeQuant lesson shows how leverage and losses affect company rankings when these ratios become equity signals. A public preview is available and the full lesson requires membership. Portfolio sorts