Cluster sampling selects groups before records. See why equal trade inclusion probabilities do not imply independent observations, and how clusters change precision.
Cluster sampling
Cluster sampling selects groups from a population, then observes all or some of the units inside the selected groups. In a one-stage design, every unit in each selected cluster is included. In a two-stage design, a further probability sample is taken within each selected cluster. The cluster is the first unit of selection; the individual record can still be the unit you want to analyse.
For a trade-cost audit, opening one desk's archived records may be expensive, while checking another trade in the same archive is cheap. Sampling desks can reduce that setup cost. The statistical trade-off is that trades from the same desk may share a broker, execution system or market exposure. A hundred recorded trades need not provide the precision of a hundred independent observations.
Ten desks, a hundred trades
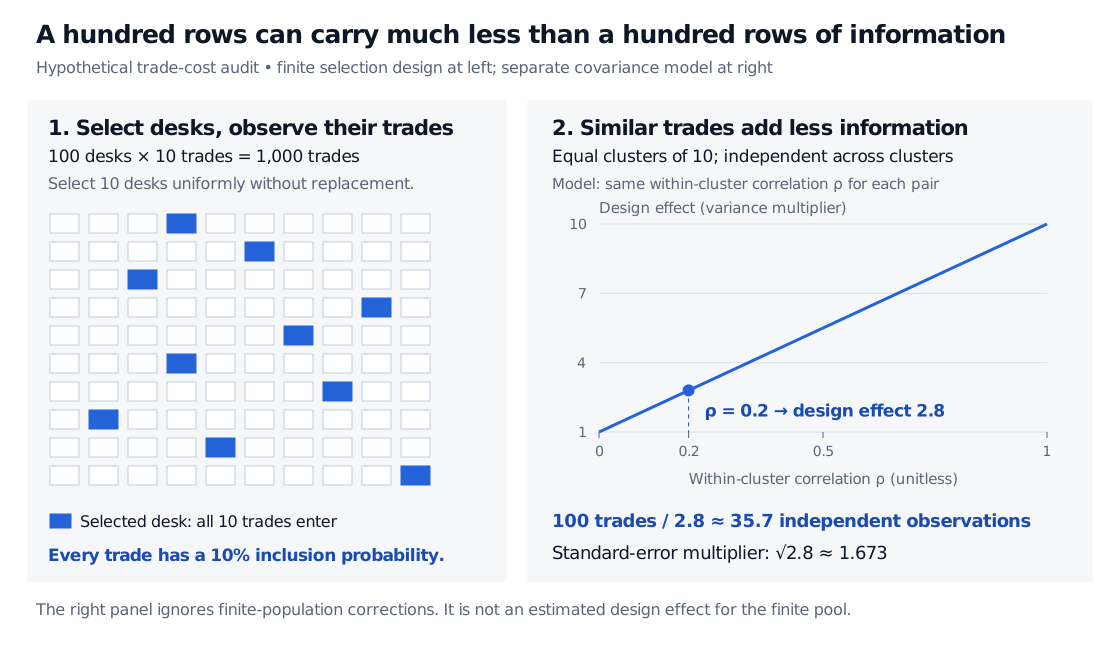
Suppose a fixed audit population contains 100 desks, each with 10 eligible trades. The target is the mean execution cost per trade across all 1,000 trades, in basis points. Choose 10 desks by simple random sampling without replacement and inspect all 10 trades on each chosen desk.
The resulting sample has 100 trades. Each trade has inclusion probability 10/100=0.1, because it enters exactly when its desk is selected. But this is not a simple random sample of 100 trades: a possible sample must contain whole desks. A collection containing only one trade from each of 100 desks cannot occur.
Equal individual inclusion probabilities do not establish independence. Two trades on the same desk always enter together. Randomly choosing the desks makes this a probability sampling design; choosing the ten easiest desks to contact would be convenience sampling, with no such known selection probabilities.
Ten blue desk squares among 100 represent a selection of 10 desks, with all 10 trades per selected desk observed. A separate equal-cluster model has design effect 2.8 at within-cluster correlation 0.2, about 35.7 independent-observation equivalents for 100 trades, and standard-error multiplier 1.673.
Hypothetical audit design at left. At right, an illustrative equal-cluster covariance model, with independent clusters and finite-population corrections ignored. The correlation is assumed, not measured from the audit.
Because every desk has the same number of trades, the mean of the 10 sampled desk means equals the mean of the 100 sampled trades. It is unbiased for the fixed population's trade-level mean under the stated random selection.
There is also a direct way to estimate its standard error. Let sb2 be the sample variance of the 10 desk means, measured in squared basis points and using denominator 10−1. Under this particular one-stage design,
SE(μ^)=(1−10010)10sb2.
The factor 1−10/100 is the finite-population correction at the desk level. The uncertainty comes from which desks were selected. Treating the 100 trade records as independent and using their standard deviation divided by 100 ignores that selection structure. Ten desks also give limited information about between-desk variation; a large row count alone does not justify a normal confidence interval.
Where the information loss comes from
A useful planning approximation makes the dependence explicit. Assume g independent clusters of equal size m, so n=gm. Every observation has variance σ2, and every distinct pair within a cluster has the same correlationρ. Ignore finite-population corrections, as in a large-population or superpopulation calculation.
Thus the mean has about the same variance as an independent mean based on 35.7 observations under this model. That effective sample size is a precision comparison, not a count of usable trades. If ρ=0, this model gives no inflation; if ρ=1, all ten observations within a cluster move together and only the ten independent clusters add information.
The 2.8 is not a universal sampling law or an estimated result for the finite audit pool. A real design effect depends on the outcome, estimator, selection design, weights and finite-population corrections. Here it follows from a deliberately simple covariance assumption. Strong common shocks across desks would also violate the model's independence across clusters.
Clusters and strata do different jobs
Design
What gets selected?
What it is trying to achieve
One-stage cluster sampling
Some groups, then every eligible unit inside those groups
Some groups, then a probability sample within each selected group
Balance group setup costs against the number of records inspected
A desk is not a stratum merely because it is a named group. If every desk contributes sampled trades, the design differs from selecting only some desks. Stratification and clustering can also coexist: divide desks into regions, then sample desks within every region.
For positive within-cluster correlation, spreading a fixed number of observations over more independent clusters generally improves precision in the equal-cluster model. Whether it is affordable depends on the cost of opening another cluster.
Keep the target and the weights aligned
Unequal cluster sizes need extra care. In one-stage sampling with equal desk-selection probabilities, every trade still has the same inclusion probability. Yet averaging desk means equally targets the mean desk, which differs from the mean trade when desk sizes differ. One design-unbiased route to a trade mean is to expand sampled desk totals by their inverse selection probabilities and divide by the known population trade count. Simply dividing by the random number of sampled trades is a different, ratio estimator.
If selection probabilities differ across desks, or only some trades are selected within desks, derive each trade's overall inclusion probability from both stages. Keep cluster identifiers and weights with the data so the uncertainty calculation can reflect the design. A cluster-robust standard error addresses specified dependence; it cannot make conveniently chosen desks representative of the target population.
For the regression extension, Robust Inference develops the cluster covariance estimator and explains why the number of clusters matters. The full lesson requires membership; its public page provides a preview.
Sources
John A. Rice, Mathematical Statistics and Data Analysis, 3rd edition (Duxbury, 2007), §7.6, p. 238: cluster sampling, within-cluster similarity and the practical limits of sampling models.
Jeffrey M. Wooldridge, Econometric Analysis of Cross Section and Panel Data (MIT Press), §§6.3.4 and 11.5: within-cluster dependence, independent-cluster asymptotics and unequal cluster sizes.
J-PAL, “Power calculations”, sections on intracluster correlation and clustered designs: the equal-cluster planning multiplier and its precision implications.