The Rule of 40 is a software-as-a-service (SaaS) benchmark that adds a company’s year-over-year growth rate to a profit or cash-flow margin. The conventional reference is 40 points, with one percentage point of growth counting the same as one percentage point of margin. Analysts use the score to screen for the combination of growth and profitability. The choice of inputs can move the same company across that reference. Brad Feld’s 2015 practitioner note.
One business, three scores
A fictional SaaS company reports recognised revenue of USD 100 million in the prior fiscal year and USD 125 million in the current fiscal year. Over that same current fiscal year, it generated USD 32.5 million of operating cash flow and paid USD 10 million in cash capital expenditure. Define free cash flow (FCF) as operating cash flow less cash capital expenditure, and divide it by current-year revenue to get the FCF margin.
The revenue-growth-plus-FCF score is 43 points. Now keep growth at 25%. Suppose operating income is USD 16.25 million, with USD 11.25 million of depreciation and amortisation included in operating expenses. Assume no non-operating items apart from interest and taxes, so unadjusted EBITDA is USD 27.5 million. Using the same current-year revenue denominator, operating margin is 13% and EBITDA margin is 22%. The scores are 38 and 47, respectively.
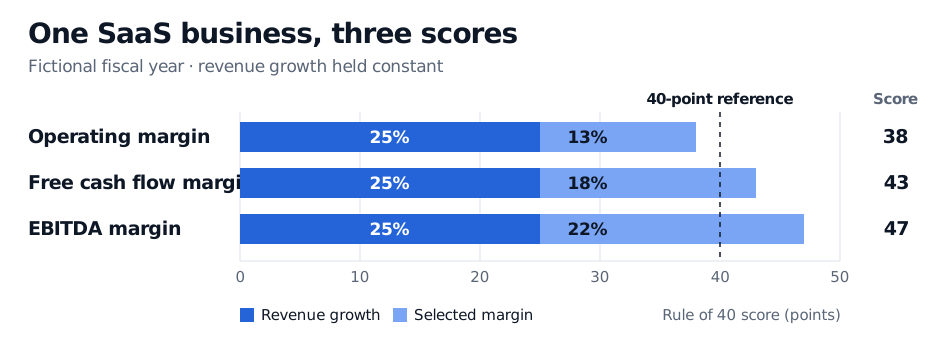
At 25% growth, the 40-point reference corresponds to a 15% margin. The chosen margin determines which side of that reference the company lands on.
The three margins capture different things. Operating profit reflects depreciation and amortisation. EBITDA adds those expenses back and leaves cash capex and working-capital movements outside the calculation. The FCF margin deducts cash capex and reflects when customers pay. If more customers prepay their annual subscriptions before year-end, this year’s operating cash flow can rise while this year’s recognised revenue stays the same. That timing can lift the FCF-based score without a matching increase in operating margin.
Compare the inputs before the scores
Recognised revenue measures sales earned over a period. Annual recurring revenue (ARR) measures the annualised recurring run rate at a date. A subscription that starts near year-end can contribute to closing ARR while adding little recognised revenue that year. The SaaS Metrics Standards Board describes an ARR version that pairs year-over-year ARR growth with annual FCF divided by average ARR. It also shows a revenue version in which the margin uses current-year recognised revenue. Replacing the growth rate can therefore change the margin denominator too. SaaS Metrics Standards Board, Rule of 40 calculation methods.
Issuer disclosures illustrate why the label alone is insufficient. F5’s 2020 Analyst and Investor Day materials used revenue growth plus non-GAAP operating margin. Zuora’s 2021 Investor Day release used subscription revenue growth plus FCF margin and listed ARR growth separately. For a peer comparison, record the growth base, margin numerator and denominator, any company-specific adjustments, and the period end. Recalculate on a common basis when the disclosures provide the inputs. F5 Analyst and Investor Day materials, Zuora Investor Day release.
The score describes the growth and margin observed together. An operating reinvestment analysis asks how much new capital that growth requires and what return the investment is expected to earn. Deferring capital expenditure can lift this year’s FCF score even as it limits future capacity. A discounted cash flow valuation takes a separate step by forecasting future cash flows and discounting them for risk and timing.
Sources
- Brad Feld, The Rule of 40% For a Healthy SaaS Company, February 2015.
- SaaS Metrics Standards Board, Rule of 40, calculation methods and sample calculations.
- F5, Analyst and Investor Day materials, Form 8-K exhibit, November 2020.
- Zuora, 2021 Investor Day release, Form 8-K exhibit, April 2021.