Measure split-adjusted net share growth, distinguish it from buyback cash and gross issuance, and interpret the historical return pattern without assuming causality.
Net share issuance anomaly
The net share issuance anomaly is the historical tendency for stocks of firms with greater increases in split-adjusted shares outstanding to earn lower subsequent average returns than stocks of firms with lower or negative increases. It turns a corporate financing outcome into a cross-sectional ranking signal: compare how much each firm's share count has expanded, then test whether that ranking predicts later returns. It is an empirical pattern, not a formula that converts dilution into a known price loss.
A buyback headline is insufficient to calculate the signal. A company can repurchase shares while issuing even more through employee compensation, acquisitions or other transactions. The relevant quantity is the change in the outstanding count after putting both endpoints into comparable units.
The split is a change of units
Let S0∗ and S1∗ be positive shares-outstanding counts at the beginning and end of a specified window, adjusted to the same split basis. A common measure is
NI=ln(S0∗S1∗).
Positive NI means net share creation; negative NI means net shrinkage. The corresponding simple growth rate is
g=S0∗S1∗−1=eNI−1.
Log growth and simple growth give the same ranking for identical windows and eligible firms, but different numerical values. Keep that convention explicit when comparing a research paper, a vendor field and a portfolio sort.
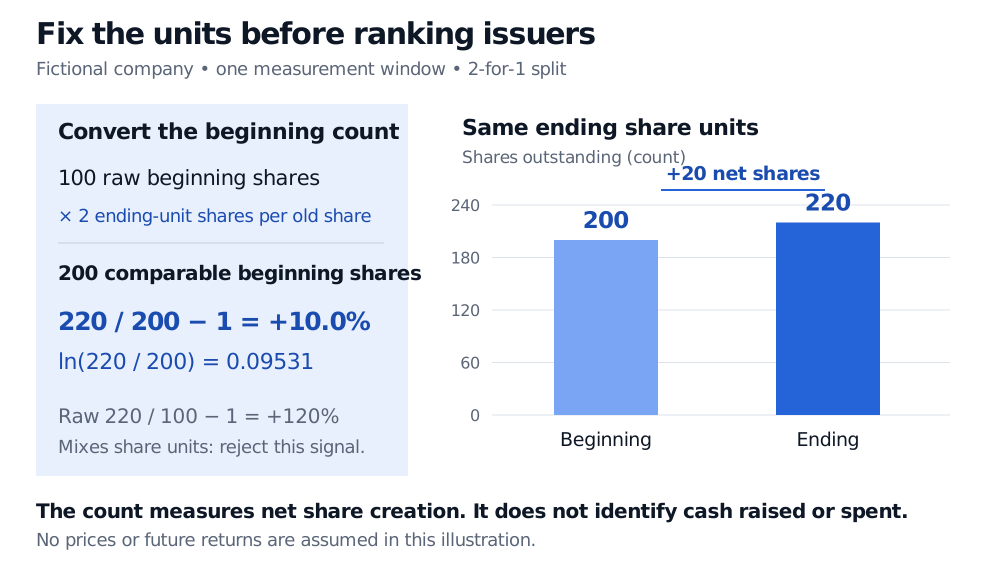
Consider a fictional firm with 100 shares at the beginning and 220 at the end. A stock split of two new shares for every old share occurs within the window. Express the beginning count in ending units: 100×2=200. Then
g=200220−1=10%,NI=ln(1.10)≈0.09531.
The raw comparison, 220/100−1=120%, mistakes a unit conversion for issuance. A pure two-for-one split ending at 200 would produce zero adjusted issuance. The log signal 0.09531 is not a 9.531% stock return; it describes share-count growth.
Fictional firm: 100 raw beginning shares become 200 in ending split units, against 220 ending shares. Correct simple growth is 10% and log growth is 0.09531; the raw comparison falsely shows 120%.
Original fictional share-count example. Both bars use ending split units; no prices or future returns are assumed.
“Adjusted” must mean the provider's documented share-count adjustment. A total-return price series is not a replacement for split-adjusted shares outstanding, and weighted-average diluted shares used in earnings per share are not automatically the required endpoint count.
Net shares do not identify gross activity or cash
Even a correct 200-to-220 comparison leaves the transaction history unresolved. One possible history is 8 shares repurchased and 28 newly issued, all measured in ending units: 200−8+28=220. Another is 20 issued and none repurchased. The same endpoint signal can conceal different gross activity.
Quantity
What it captures
Why it differs from net share issuance
Gross issuance
Shares created before offsetting repurchases
Does not subtract shares removed
Net cash spent on repurchases
Repurchase cash less issuance cash, under a stated cash-flow definition
Depends on transaction prices and cash classification; stock compensation and stock-financed acquisitions need not raise cash
Change in book equity
Accounting change in shareholders' equity
Includes retained earnings and other accounting movements beyond share transactions
Net share-count growth
Difference between comparable endpoint counts
Aggregates creation and removal without identifying their purpose or cash value
Shareholder yield combines payout measures under its own definitions. Buyback announcement drift concerns returns following an announcement. Neither is interchangeable with a signal based on realised outstanding counts. Likewise, issuing shares to finance investment does not make this signal identical to the investment factor.
A ranking needs an information date
Kenneth French's data-library construction provides a concrete convention: portfolios are formed at each June end using the log change in split-adjusted shares between fiscal year-ends in calendar years t−2 and t−1, with NYSE breakpoints. Eligible exchange-listed stocks need June market equity and both share-count observations. This is one documented construction, not a universal definition of the anomaly. A monthly trailing-window measure is a different specification. French's construction notes state the timing and eligibility directly.
In a backtest, fiscal year-end describes when the count applies; it does not establish when the researcher could obtain it. Preserve publication or vendor availability, revisions and instrument identity. Otherwise a well-adjusted signal can still contain look-ahead bias.
Maintain the historical universe, including later failures and exits, to avoid survivorship bias. Missing share counts are missing inputs, not zero issuance. Review mergers, share-class changes and other reorganisations that can change what the endpoint count represents. Compare results across size groups, weighting choices and issuance versus repurchase subsamples: their changing composition can change the measured spread.
The Corporate Actions and Survivorship lesson develops split invariance, adjusted research series and historical-universe reconstruction. Its preview is public; the full lesson requires membership.
Evidence supports a hypothesis, not a corporate-policy rule
Pontiff and Woodgate (2008) report strong post-1970 predictive evidence, while finding no statistically significant predictive ability before 1970 for most holding periods. Fama and French (2008) find the net-stock-issues pattern across micro, small and big stocks. The historical period and cross-section both matter.
McLean, Pontiff and Watanabe (2009) extend the evidence internationally, with a larger contribution from weak returns after issuance than from strong returns after repurchases. That asymmetry cautions against treating “buybacks beat issuers” as one identical mechanism in every market.
These associations do not establish that forcing a firm to repurchase shares would increase its expected return. Financing decisions are related to valuation, investment opportunities and firm characteristics; an observed count change does not identify which explanation drives the return pattern. Nor does a historical spread guarantee future alpha. An investable test still needs genuinely later returns, a stated risk benchmark, feasible short positions, borrow costs and transaction costs.
Sources
Jeffrey Pontiff and Artemiza Woodgate (2008), Share Issuance and Cross-sectional Returns, Journal of Finance 63(2), 921–945. Original study; the publisher's abstract reports the historical-period contrast.
Eugene F. Fama and Kenneth R. French (2008), Dissecting Anomalies, Journal of Finance 63(4), 1653–1678. Original study; the publisher's abstract reports the size-group findings.