Value a growing dividend stream and see how the spread between required return and perpetual growth drives the estimate.
Gordon growth model
The Gordon growth model is a dividend discount model that values a share as the present value of its expected future dividends, assuming they grow at a constant rate forever. Analysts use it to value a company whose payouts are already growing steadily or to estimate the equity value after a company reaches stable growth. A small change in the gap between the required return and perpetual growth can move the estimate sharply. Damodaran, Valuation Basics
Start with the dividend a buyer will receive
For annual payments, let D1 be the expected dividend per share one year from today, r the annual required return on equity and g the annual growth rate of dividends per share. Then the model value today is
P0=r−gD1,r>g.
Assume both rates are above −100%, so dividends stay positive and the discount factors are defined. Each year the dividend grows by a factor of 1+g, while its discount factor shrinks by a factor of 1/(1+r). So each discounted dividend is (1+g)/(1+r) times the previous one. Summing that geometric series from D1/(1+r) gives the formula. For positive dividends, if g=r the discounted payments stay the same size. If g>r they increase. In both cases the sum diverges.
Suppose a fictional share will pay USD 3.00 in one year, its nominal cost of equity is 8% and its dividend grows at 2% annually thereafter. The value is USD 50 per share because 3/(0.08−0.02)=50. If you start with the last annual dividend D0 and assume the same growth into year one, forecast D1=D0(1+g) first. With a next-year dividend already forecast, use it directly.
Test the spread and the payout together
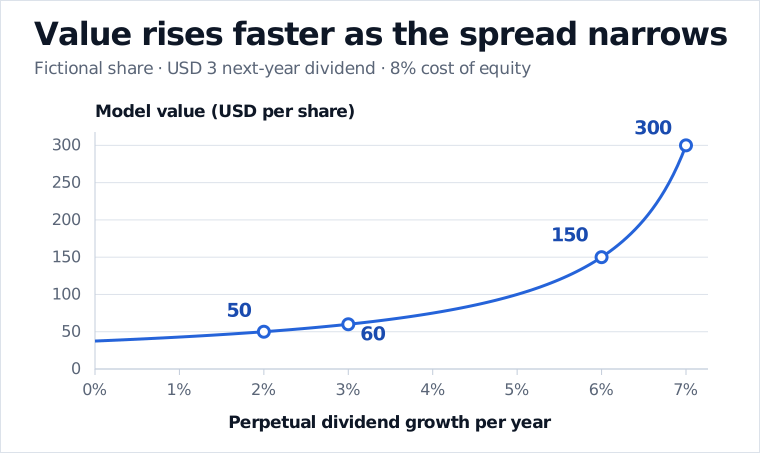
Hold the next-year dividend at USD 3.00 and the required return at 8%. Moving growth from 2% to 3% adds USD 10 per share. Moving it from 6% to 7% adds USD 150. With a thinner spread, more of the model value comes from dividends far into the future.
For a fictional share with a USD 3 next-year dividend and an 8% cost of equity, estimated value rises from USD 50 at 2% perpetual growth to USD 60 at 3%, then from USD 150 at 6% to USD 300 at 7%.
With the first dividend and cost of equity held fixed, a one-percentage-point increase in growth has a larger effect as growth approaches the discount rate.
When a firm funds growth by retaining earnings, revisit the dividend forecast as well. Suppose next year's earnings are USD 4.00 per share and new investment earns 8% on retained equity. At a constant payout ratio, retaining 25% supports 2% annual growth and leaves USD 3.00 for the first dividend. Retaining 37.5% supports 3% growth and leaves USD 2.50. The model still gives USD 50 per share because 2.50/(0.08−0.03)=50. Here, the return on reinvested equity equals shareholders' required return, so the lower payout exactly offsets the faster growth. For a real forecast, check whether the business can fund its assumed growth and sustain it relative to the economy it serves. Keep the cash flows and both rates on the same currency and nominal or real basis. Damodaran, Excess Returns and Terminal Value
Keep the cash flow, discount rate and valuation date aligned
If growth stabilises after year T of an explicit dividend forecast, the same formula gives a terminal value at the end of year T. Use DT+1 and the stable-phase cost of equity and growth rate. Then discount that terminal value back to today alongside the explicitly forecast dividends. This lets the near-term payout follow its own path.
The growing-perpetuity formula also works for other cash flows when the inputs describe the same claim. Dividends are distributions to shareholders. Free cash flow to equity (FCFE) measures what is available to distribute to shareholders after reinvestment and net debt flows, and it also goes with the cost of equity. Free cash flow to the firm (FCFF) goes with the weighted average cost of capital and gives the value of the operations. Reaching common equity from that estimate requires an enterprise-to-equity bridge. In each version the growth assumption applies to the cash flow in the numerator. Damodaran, Valuation Basics
The opening of section 2 of the SelfMadeQuant lesson derives the growing-dividend formula. Section 2.1 then shows how retained earnings and reinvestment returns determine dividend growth in the model. The preview is public, and the full lesson requires membership. Equity Valuation: Dividend Discount and DCF Models