A flat yield curve has the same, or approximately the same, quoted yield across a stated range of maturities. It describes the curve's shape at a particular observation date. In a valuation model, assuming a flat zero-rate curve lets a quant discount payments at different dates using one rate convention; it does not make those payments equally valuable today.
The phrase needs a qualifier: flat which yield curve, over which maturities, and for which instruments?
Name the curve before calling it flat
| Curve family | What the rate measures | What “flat” describes |
|---|---|---|
| Zero or spot rates | Today's rate for a single payment at a specified maturity | Equal quoted zero rates across those maturities |
| Par yields | The coupon rate that makes a standard coupon bond worth face value under a stated schedule | Equal par coupon rates across the specified bond maturities |
| Forward rates | Rates implied today for specified future lending periods | Equal implied rates across those future periods, with their tenors and quote basis identified |
A graph of coupon bonds' yields to maturity is another possible representation. Each yield summarises several dated cash flows, so it should not be substituted for a maturity's zero rate without justification. The Bank of England's terminology guide explains this distinction between spot yields and coupon-bond yields.
These families are related through prices, but a pair of similar headline yields does not establish that every representation is flat. For a concrete source-label check, the U.S. Treasury describes its official curve as a par yield curve. The Bank of England publishes spot and instantaneous forward curves and specifies continuous compounding for those quotes. Matching the displayed percentages alone would miss that difference.
A flat 4% zero curve still discounts the later payment more
Take a synthetic USD single-curve model with an annual effective zero rate of 4%, flat over the displayed one-to-two-year interval. Time is measured in stipulated years; this is not a market observation or a claim about a particular calendar day-count rule. Assume certain payments, with no taxes or fees.
A discount factor is the present price of one unit paid at its stated future date. At the two annual nodes,
The rate is unchanged. The second payment is further away, so its factor is smaller.
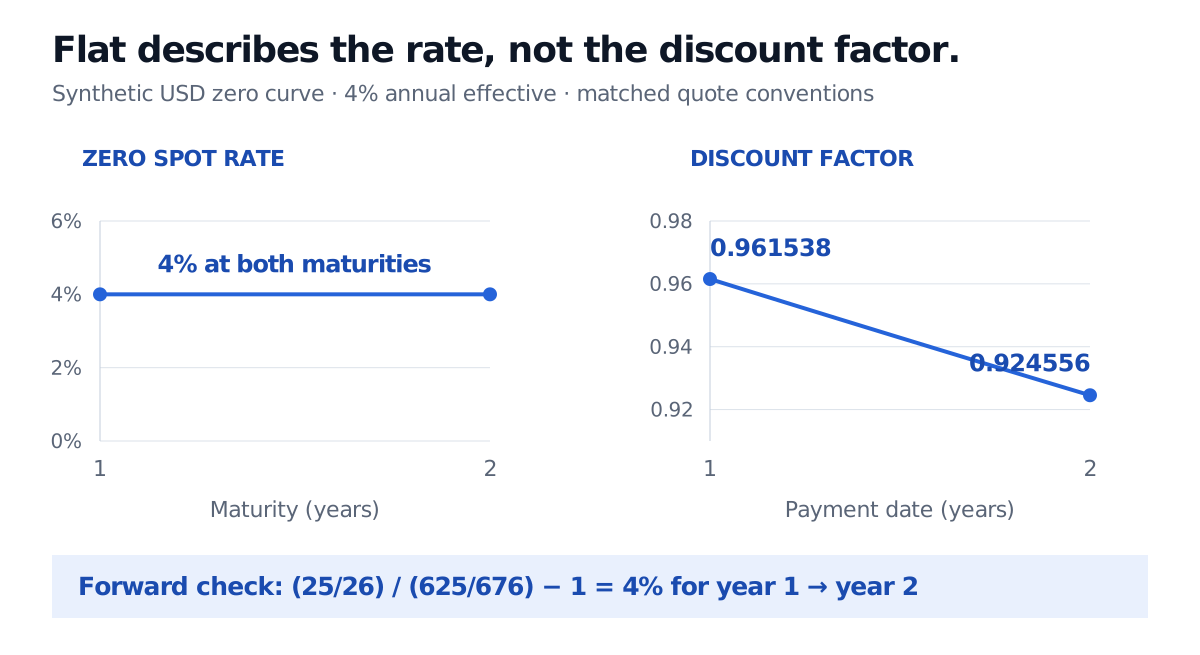
Original synthetic USD model. Separate axes distinguish a rate in percent from a dimensionless discount factor. The line between the factor nodes follows the stipulated flat zero-rate model.
The implied annual effective forward for the one-year interval from year one to year two satisfies
One way to check the direction is to construct a forward lender's cash flows: pay 1 USD at year one and receive 1.04 USD at year two. Their present values net to zero because . The forward is a rate locked into today's relative prices, rather than a guaranteed future spot rate.
Now consider a two-year bond with 100 USD face value, paying a 4 USD annual coupon. Its payments are 4 USD at year one and 104 USD at year two. The price is exactly
Its par coupon rate is therefore 4% under this annual schedule. Here the zero rates, the one-year forward and the annual par coupon rate coincide. That equality follows from the matched model and conventions; it is not a licence to mix annual, semiannual and continuous quotes.
For more on pricing the dated payments and distinguishing coupon from yield, Bonds and Yields develops the cash-flow framework. Its public page provides a preview; the full lesson requires membership.
What a flat curve leaves open
“Flat” is always relative to the range examined. Equal one-year and two-year yields say nothing by themselves about the ten-year point, or even the shape between those two nodes. The example explicitly supplies the intervening flat-curve assumption. In market commentary, approximately flat also needs a tolerance: a chart's vertical scale can hide economically meaningful differences.
Compare the same currency, observation date, nominal or real basis, credit and collateral framework, compounding convention and day-count convention. A flat government curve and a sloping corporate curve can coexist because they describe different claims.
Finally, a flat curve does not mean rates will stay constant as calendar time passes, that longer bonds have no interest-rate risk, or that future policy rates are known. Forward rates also reflect pricing effects such as term premia. Even the falling discount factors in the figure depend on the positive rate: a flat zero rate gives factors of one, while a flat negative annual effective rate above −100% gives increasing factors. Flatness concerns the rate's maturity pattern, not a universal direction for prices or a forecast.
Sources
- Bruce Tuckman, Fixed Income Securities: Tools for Today's Markets, 2nd ed., Wiley, 2002, Chapter 2, pp. 25–30 (spot rates, discount factors and forward-rate consistency), and Chapter 3, pp. 47–49 (zero and par yield representations). The worked USD example above is original and uses annual rather than the book's semiannual compounding.
- Bank of England, Yield curve terminology and concepts, especially “Nominal zero coupon yields,” “Nominal forward rates” and footnote 3; and Yield curves, quotation methodology and forward-rate interpretation. Checked 26 October 2026.
- U.S. Department of the Treasury, Treasury Yield Curve Methodology, revised 18 February 2025, checked 26 October 2026: identifies the official curve as a par yield curve.