Skip to content

Eigenvector

An eigenvector keeps its line under a matrix map. See how covariance eigenvectors describe risk directions, why normalisation changes portfolio variance, and where interpretation can fail.

An eigenvector of a square matrix AA is a nonzero vector v\mathbf{v} that the matrix maps to a scalar multiple of itself:
Av=λv,v≠0.A\mathbf{v}=\lambda\mathbf{v},\qquad \mathbf{v}\ne\mathbf{0}.
The scalar λ\lambda is the associated eigenvalue. For real vectors and eigenvalues, the image stays on the same line: a positive eigenvalue preserves orientation, a negative one reverses it, and zero sends the vector to zero. Zero is an allowed eigenvalue; the zero vector is never an eigenvector.
For a quant, an especially useful case is a covariance matrix. Its eigenvectors identify combinations of assets that separate the model's return variation into uncorrelated modes. They describe risk directions, not forecasts of which assets will outperform.

Two assets: together or against each other

Suppose a risk analyst uses this hypothetical covariance matrix for two assets' simple returns over the same fixed horizon:

Σ=(0.040.010.010.04).\Sigma=\begin{pmatrix} 0.04&0.01\\ 0.01&0.04 \end{pmatrix}.

Returns are recorded as decimals, so the entries have units of squared decimal return. Each asset has volatility 0.04=20%\sqrt{0.04}=20\% over that horizon. Their correlation is 0.01/(0.20×0.20)=0.250.01/(0.20\times0.20)=0.25.

Multiplying by two candidate directions gives

Σ(11)=(0.050.05)=0.05(11),Σ(1−1)=(0.03−0.03)=0.03(1−1).\begin{aligned} \Sigma\begin{pmatrix}1\\1\end{pmatrix} &=\begin{pmatrix}0.05\\0.05\end{pmatrix} =0.05\begin{pmatrix}1\\1\end{pmatrix},\\ \Sigma\begin{pmatrix}1\\-1\end{pmatrix} &=\begin{pmatrix}0.03\\-0.03\end{pmatrix} =0.03\begin{pmatrix}1\\-1\end{pmatrix}. \end{aligned}

Both are eigenvectors. The first combines the assets with the same sign; the second contrasts them. Positive covariance makes the same-sign direction more variable than the opposing-sign direction when their lengths are matched. By comparison, (1,0)⊤(1,0)^\top is not an eigenvector: its image (0.04,0.01)⊤(0.04,0.01)^\top acquires a second component and leaves the original line.

These names describe this two-asset model. In a large universe, a leading eigenvector need not mean “the market,” and a low-variance direction need not be a profitable spread.

Why the normalisation changes the risk number

Eigenvectors do not come with a position size. If v\mathbf{v} is an eigenvector, then cvc\mathbf{v} is another for every nonzero scalar cc:

A(cv)=cAv=λ(cv).A(c\mathbf{v})=cA\mathbf{v}=\lambda(c\mathbf{v}).
In particular, flipping every sign produces an equally valid eigenvector. To compare directions, it is common to set their Euclidean norm to one:
q+=12(11),q−=12(1−1).\mathbf{q}_+=\frac{1}{\sqrt{2}}\begin{pmatrix}1\\1\end{pmatrix}, \qquad \mathbf{q}_-=\frac{1}{\sqrt{2}}\begin{pmatrix}1\\-1\end{pmatrix}.

For any unit eigenvector of a covariance matrix,

Var(q⊤R)=q⊤Σq=λq⊤q=λ,\text{Var}(\mathbf{q}^\top\mathbf{R}) =\mathbf{q}^\top\Sigma\mathbf{q} =\lambda\mathbf{q}^\top\mathbf{q} =\lambda,

where R\mathbf{R} is the return vector. Thus the unit directions above have variances 0.050.05 and 0.030.03. Their volatilities are approximately 22.36%22.36\% and 17.32%17.32\% over the chosen horizon. These are linear return combinations with unit vector length; their coefficients are not automatically fully invested portfolio weights.
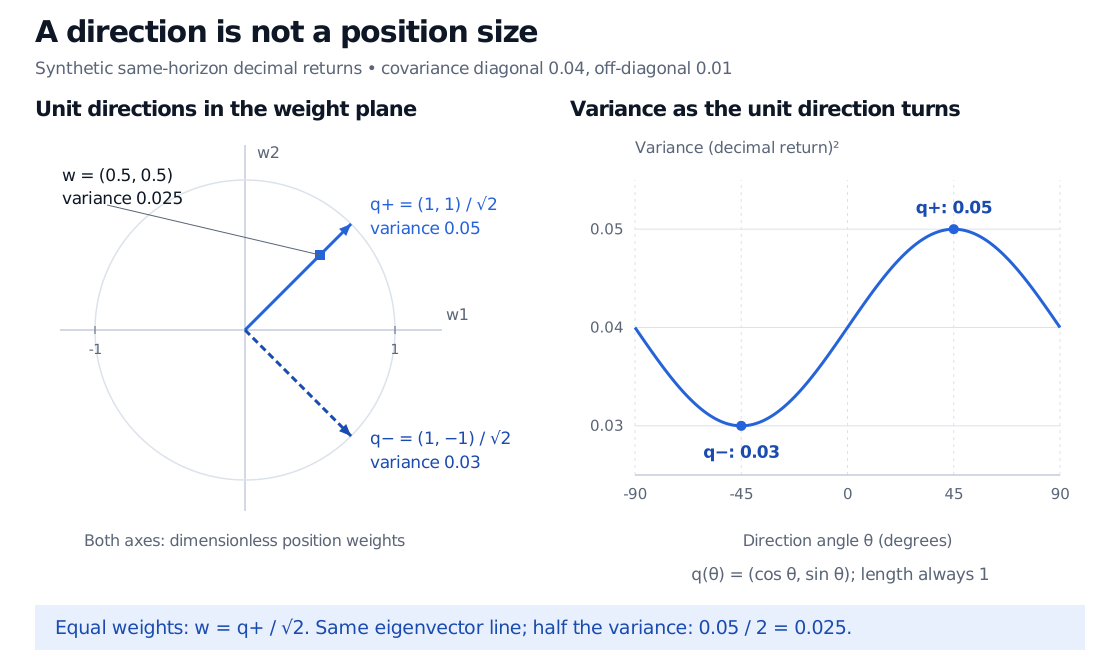
Two unit eigenvectors in a dimensionless weight plane and their directional variance curve. The same-sign unit direction has variance 0.05; the opposite-sign unit direction has variance 0.03. Fully invested weights 0.5, 0.5 share the same-sign line but have variance 0.025.
Original synthetic two-asset example. The curve evaluates variance only for unit-length directions. The square marker in the left panel uses a smaller position on the same eigenvector line.

A fully invested equal-weight portfolio has w=(0.5,0.5)⊤=q+/2\mathbf{w}=(0.5,0.5)^\top=\mathbf{q}_+/\sqrt{2}, so

Var(w⊤R)=14(0.04+0.01+0.01+0.04)=0.025.\text{Var}(\mathbf{w}^\top\mathbf{R}) =\frac{1}{4}(0.04+0.01+0.01+0.04) =0.025.
Its volatility is approximately 15.81%15.81\%, not 22.36%22.36\%. The direction is unchanged, but variance scales with the square of position size. Likewise, weights (0.5,−0.5)⊤(0.5,-0.5)^\top, with gross exposure one, have variance 0.0150.015; they sum to zero and cannot be turned into weights summing to one simply by dividing by their sum. A tradable portfolio still needs explicit capital, leverage, financing and short-sale conventions.

From two directions to a risk decomposition

A real covariance matrix is symmetric and positive semidefinite. The spectral theorem guarantees an orthonormal basis of eigenvectors qi\mathbf{q}_i with nonnegative eigenvalues λi\lambda_i. For any position vector, define ai=qi⊤wa_i=\mathbf{q}_i^\top\mathbf{w}. Then
w⊤Σw=∑iλiai2.\mathbf{w}^\top\Sigma\mathbf{w} =\sum_i\lambda_i a_i^2.

This separates a mode's inherent variance, λi\lambda_i, from the book's exposure to it, aia_i. A high-variance mode contributes little to a book that barely loads on it. Conversely, a low-variance spread can become a large risk after leverage.

In principal component analysis, the leading unit eigenvector maximises projected variance. Here it accounts for 0.05/(0.05+0.03)=62.5%0.05/(0.05+0.03)=62.5\% of the sum of the two assets' variances. That fraction measures a property of the covariance model; it is not the share of every portfolio's risk and says nothing about expected return. Orthogonal component scores are uncorrelated, which alone does not make them statistically independent.

Reading eigenvectors from data

A few checks matter when interpreting a reported eigenvector:

  • Sign: a software output may reverse all signs between runs without changing the underlying line. Compare aligned directions rather than individual sign changes.
  • Repeated eigenvalues: if an eigenvalue is repeated, its eigenspace may have many equally valid orthonormal bases. Even distinct but closely spaced eigenvalues can produce individual directions that move substantially when the estimated covariance changes. A stable subspace can be more meaningful than one labelled vector.
  • Units and scaling: both coordinates above are same-horizon returns in the same decimal convention. Changing the scale of only one variable generally changes covariance eigenvectors. Using a correlation matrix instead means analysing standardised variables; its coefficients require conversion before being read as exposures to the original returns. Mixing raw currency moves, basis-point changes and returns without a stated scaling convention makes the geometry economically ambiguous.
  • Matrix type: general square matrices need not have real eigenvectors or a complete eigenvector basis. The covariance conclusions rely on symmetry and positive semidefiniteness. In numerical work, check the residual Σq−λq\Sigma\mathbf{q}-\lambda\mathbf{q} and normalisation, but remember that a small residual does not establish that an estimated risk direction will remain stable out of sample.
For a worked continuation, Eigenvalues and Covariance Matrices develops the spectral decomposition and variance coordinates. PCA and Factor Compression connects those directions to a centred return panel. Both offer public previews; full lessons require membership.

Sources

  • Gene H. Golub and Charles F. Van Loan, Matrix Computations, 4th edition, Johns Hopkins University Press, 2013, §2.1.7, §7.1.1 and §8.1.3: eigenpairs, symmetric matrices, directional quadratic forms, invariant subspaces and eigenvector sensitivity.
  • Gilbert Strang, Lecture 4: Eigenvalues and Eigenvectors, MIT OpenCourseWare, 18.065, Spring 2018: real and complex eigenvectors, zero eigenvalues and the symmetric case.
  • NIST/SEMATECH, e-Handbook of Statistical Methods, §6.5.5.1: Properties of Principal Components: unit-length coefficients, maximum projected variance and diagonal component covariance.
Last updated
  • linear algebra
  • eigenvectors
  • covariance
  • portfolio risk
  • normalisation
  • pca
← Back to the glossaryBack to top ↑