A valuation multiple divides the market value of a business or ownership stake by a financial measure such as earnings, revenue or book value. It tells you how much the market pays per unit of that measure, so a large company and a small company can be compared on the same scale. In comparable company analysis, the comparison starts by calculating the same ratio on the same basis for each company. Damodaran, The Anatomy of a Multiple
One company, two multiples
A fictional company has common equity worth 200 million USD and enterprise value of 240 million USD on the same date. Over the last four reported quarters, it earned 10 million USD attributable to common shareholders and recorded 24 million USD of EBITDA, or earnings before interest, taxes, depreciation and amortisation.
The market values common equity at 20 dollars per dollar of earnings attributable to common shareholders. The operating business is valued at 10 dollars per dollar of EBITDA, a measure calculated before interest. Both ratios can hold at once because they pair different claims with different measures of earnings. Dividing common equity value by EBITDA would mix the price of one claim with earnings measured before lenders are paid. The usual quoted P/E uses the share price and earnings per share. Check the share-count basis when reconciling it with an aggregate calculation. CFA Institute, Price and Enterprise Value Multiples
Trailing and forward answer different questions
Trailing multiples use reported results, typically the latest four available quarters. Forward multiples use an estimate for a specified period, such as the next twelve months or the next fiscal year. Use the same convention for every company in the comparison. If forecast common earnings are 16 million USD over the next twelve months, the same 200 million USD equity value gives a forward P/E of 12.5×. The drop from 20× comes entirely from higher earnings in the denominator. CFA Institute, Price and Enterprise Value Multiples
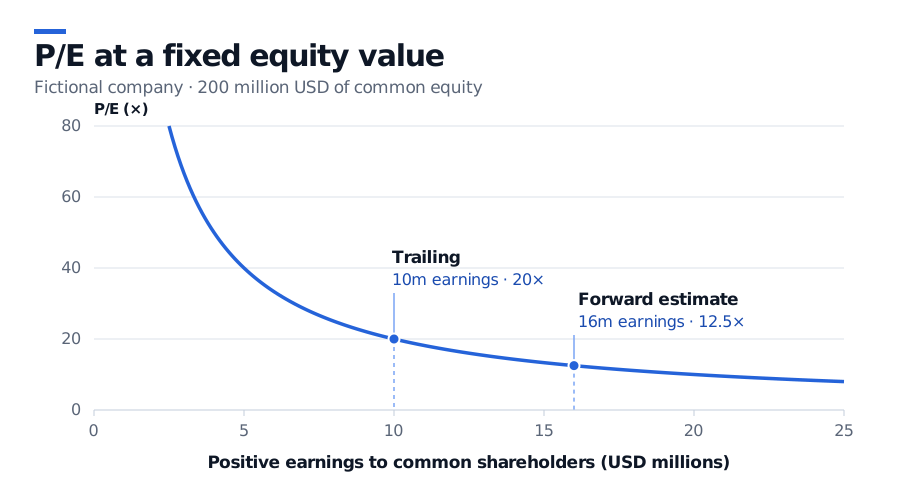
At a fixed price, the same change in earnings moves P/E more when the starting earnings figure is small.
For a historical screen, set the valuation date and use the filings and forecast versions that were available at that time. A quarter can have ended before the valuation date while its results are still unpublished. A later restatement or forecast revision creates look-ahead bias if it enters the historical ratio. The SelfMadeQuant lesson works through this with an earnings release and a later revision. The preview is public and the full lesson requires membership. Point-in-time data
When the denominator drives the result
At a positive equity value, a small positive earnings figure can send P/E sharply higher. Zero earnings leave P/E undefined. Losses produce a negative ratio that has no ordinary interpretation in a low-P/E ranking. Flag those observations before taking a peer median. An unusual gain or charge can also move P/E by temporarily changing earnings. If you use adjusted earnings, document the exclusions and apply the same treatment across the comparison. The same discipline applies to EBITDA, especially when firms define adjustments differently or need different amounts of reinvestment to sustain their operations. Damodaran, The Anatomy of a Multiple, CFA Institute, Price and Enterprise Value Multiples
Even with comparable denominators, firms can trade at different multiples because their expected growth, risk or capacity to generate cash differs. The PEG ratio divides P/E by expected earnings-per-share growth. Its interpretation becomes unstable around zero growth and its comparison assumes a roughly proportional link between growth and P/E. A cross-sectional regression can instead estimate a benchmark P/E conditional on several inputs, such as growth, payout and risk. Its benchmark reflects the market prices, firms and inputs used to fit it. Damodaran, Controlling for Differences across Firms
Sources
- Aswath Damodaran, NYU Stern, The Anatomy of a Multiple and Controlling for Differences across Firms.
- CFA Institute, 2026 Level II curriculum, Market-Based Valuation: Price and Enterprise Value Multiples.