A time series can be regularly spaced, such as a monthly economic indicator, or irregularly spaced, such as transactions recorded whenever a trade occurs. Many standard statistical methods assume regular spacing, so the observation clock must be specified before applying them.
Three prices are more than an unordered list
Suppose a fictional stock has the following closing prices on three consecutive trading sessions. Prices are USD per share; assume no dividends, splits or other corporate actions.
| Observation | Session | Closing price | Simple return since previous close |
|---|---|---|---|
| 1 | Monday | 100 | Not available |
| 2 | Tuesday | 102 | +2.000000% |
| 3 | Wednesday | 101 | −0.980392% |
Writing the price at observation as , the simple close-to-close return is
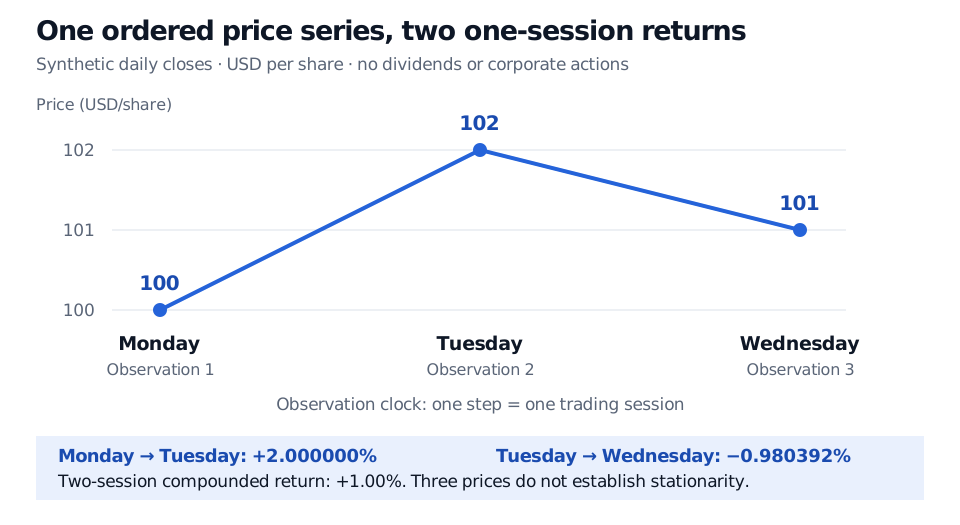
The return from Monday's close to Wednesday's close is . Equivalently,
Adding the two percentage returns does not give the exact compounded return. Reordering prices also changes which prices form consecutive pairs. Sorting the values from smallest to largest would replace the observed history with an invented one. Sorting records by their valid timestamps restores chronology; sorting them by price destroys it.
A lag belongs to a clock
“One observation earlier” is not always “one calendar day earlier.” In a trading-session series, Monday's preceding close may be Friday's. In transaction time, the preceding trade may have occurred milliseconds or minutes earlier. If elapsed calendar time matters to the model, retain it rather than treating every row gap as an equal duration.
The recorded field matters too. A closing price is a snapshot; daily trading volume is an amount accumulated over a session. Converting daily data to weekly data typically takes the last observed close for price and sums volume. A weekly date label does not prove the week is complete. Likewise, an absent quote cannot be silently replaced with a zero price or zero return. Carrying the last price forward is a separate stale-price assumption.
For multiple assets, align economically comparable observation periods. Two exchanges' “daily closes” can occur at different instants, even when their records carry the same date. Record the time zone and the meaning of the timestamp before interpreting a lead or lag.
One history, many possible histories
This distinction matters when estimating an average or risk measure. Averaging observations along one path does not automatically reproduce an average across all possible model histories. That relationship needs assumptions about the process and its long-run behaviour.
Time order allows dependence; it does not require it. Autocorrelation measures linear association between a series and its lagged values. In a covariance-stationary model with positive variance,
Forecast using information that existed then
A forecast made after Tuesday's close can use that close once it is available. It cannot use Wednesday's close. Economic data introduce another complication: the period a number describes, its release date and a later revision date may differ. Labelling a revised number with an old observation period does not make it historically available.
Sources
-
Chris Brooks, Introductory Econometrics for Finance, 2nd edition (Cambridge University Press, 2008), §1.3.1, “Time series data,” pp. 3–5: observation frequency, irregular financial records and aggregation to a chosen frequency.
-
NIST/SEMATECH e-Handbook, §6.4.1: Definitions, Applications and Techniques: the regularly spaced setting and the uses of time-series models.
-
Rob J. Hyndman and George Athanasopoulos, Forecasting: Principles and Practice, 3rd edition, §5.10: Time series cross-validation: evaluation using training observations preceding each test observation.
-
NIST/SEMATECH e-Handbook, §1.3.3.1: Autocorrelation Plot: lagged association and why a lack of autocorrelation does not establish independence.