A company’s sustainable growth rate is the rate at which sales can grow using retained earnings and borrowing consistent with its target leverage, assuming stable margins and capital needs per dollar of sales and no new equity issuance. Higgins, How Much Growth Can a Firm Afford?
The reinvestment identity says that operating-profit growth from new investment equals the share of after-tax operating profit reinvested times the return earned on that new capital. If existing operations earn the same profit next year, this product gives total operating-profit growth. A valuation analyst can turn a growth forecast into a reinvestment budget and see how much cash the business would have left. Damodaran, Growth Rates
Follow the capital into next year's profit
Let be year net operating profit after tax (NOPAT), before interest, and be net operating reinvestment in that year. In a simple operating forecast, reinvestment is capital spending less depreciation, plus the increase in noncash operating working capital. Suppose the new capital is in place at the start of year and earns a full year of incremental return on invested capital (ROIC), . If existing operations still earn , the extra profit is , so
A fictional manufacturer earns USD 100 million of NOPAT in year one and reinvests USD 40 million. If the new capacity earns 15% in year two, it adds USD 6 million of NOPAT. With the existing plants still earning USD 100 million, year-two NOPAT rises to USD 106 million, a 6% increase. The 15% is the expected return on the expansion. Company-wide historical ROIC blends returns on past investments and may tell you little about what the next plant will earn. If existing plants improve margins or the new capacity takes longer to ramp up, model those profit changes and investment lags explicitly. Damodaran, Growth Rates
The same growth can leave less cash
At an 8% return on new capital, the manufacturer would need to reinvest of NOPAT to get the same 6% growth. In this model, free cash flow to the firm (FCFF) is NOPAT less net operating reinvestment. The 15% plan leaves USD 60 million of year-one FCFF. The 8% plan leaves USD 25 million.
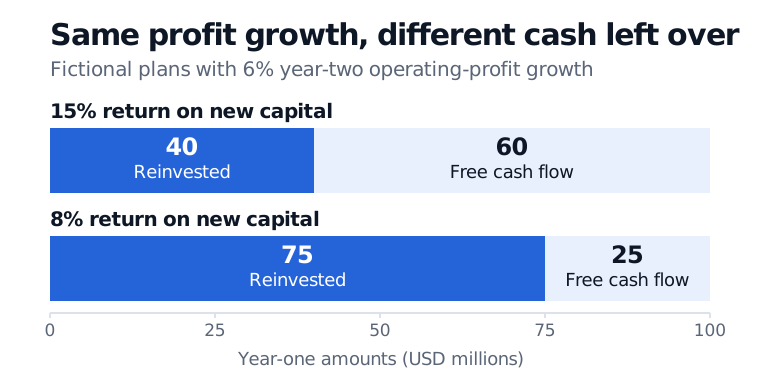
The lower-return plan uses more of the same starting profit to achieve the same growth.
If both projects have a risk-appropriate cost of capital of 10%, the 15% project earns a positive spread and the 8% project earns a negative one. Both add the same operating profit, but the second uses enough capital to generate negative incremental economic value added in year two. In a steady-growth DCF, changing the growth forecast while holding the expected return on new capital fixed also changes the reinvestment and FCFF forecasts. A reverse DCF that solves for implied FCFF still needs separate growth and return assumptions to translate that cash flow into a reinvestment budget. Damodaran, Applied Corporate Finance, chapter 12
Retention and ROE answer an equity question
The equity version starts with net income after interest and the retention ratio , the share of net income kept after dividends. If retained earnings are the only change to book equity, the increase in equity is times net income. Dividing by opening book equity gives book-equity growth of , where uses that year's net income over opening equity. Using the same income over closing equity, instead measures the addition as a share of the closing balance. For growth relative to opening equity, convert it to .
Higgins uses this financing logic to ask how fast sales can grow with no new equity issuance, a fixed payout and debt-to-equity ratio, and stable net margins and assets per dollar of sales. Retained earnings expand the equity base, and borrowing can rise in proportion to preserve leverage. In a separate constant-return dividend forecast, steady ROE on opening equity and a constant payout allow earnings and dividends to grow at the book-equity growth rate. That is the link to the Gordon growth model. Higgins, How Much Growth Can a Firm Afford?
Section 2.1 of the SelfMadeQuant lesson shows how returns on retained earnings feed into next year's dividends. The preview is public and the full lesson requires membership. Equity Valuation: Dividend Discount and DCF Models
Sources
- Aswath Damodaran, The Little Book of Valuation, Growth Rates.
- Aswath Damodaran, Applied Corporate Finance, chapter 12, Valuation.
- Robert C. Higgins (1977), How Much Growth Can a Firm Afford?, Financial Management, 6(3), pp. 7–16.