A sample path is one history of a stochastic process. See why the same final inventory can hide different risk-limit events, and why plotted connectors are not observations.
Sample path
A sample path is one complete time history of a stochastic process, obtained by fixing its random outcome. For a dealer, it could be one sequence of inventory levels through the trading day. The final inventory tells you where the dealer finished; the path tells you whether a risk limit was reached along the way.
If the process is written Xt(ω), the two directions are:
Fixing the outcome is a mathematical way to select a history. It does not mean that an observer knows the future of an unfolding market history.
A finish does not identify a history
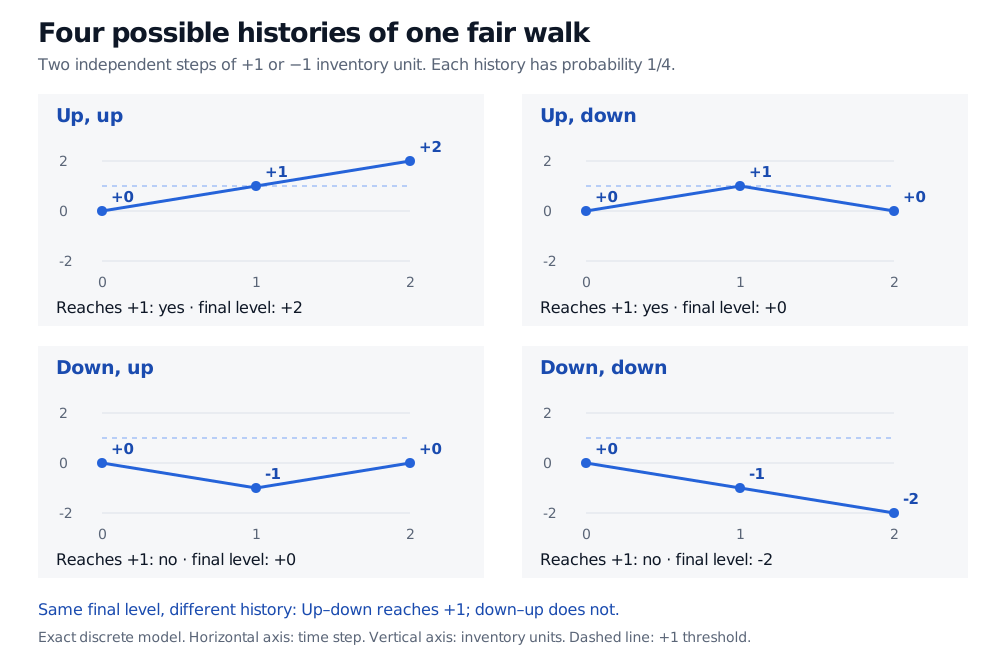
Take a hypothetical random walk starting at zero inventory. At each of two steps, inventory changes by either +1 or −1 unit, independently, with equal probability. There are four possible paths:
Step directions
Inventory at times 0, 1, 2
Reaches +1 at a model time?
Up, up
(0,1,2)
Yes
Up, down
(0,1,0)
Yes
Down, up
(0,−1,0)
No
Down, down
(0,−1,−2)
No
Each row has probability 1/4. The two middle rows both finish at zero, but only the up–down path reaches the +1 threshold. Here “reaches” includes touching, and monitoring occurs at the model times 0, 1 and 2. Thus
P(X2=0)=21,P(k∈{0,1,2}maxXk≥1)=21.
These happen to have the same probability, but they are different events: the down–up path belongs only to the first, and the up–up path only to the second. Even after learning that final inventory is zero, there is still a 1/2 conditional probability that the threshold was reached.
Four equally likely inventory paths, each starting at zero: 0,1,2; 0,1,0; 0,-1,0; and 0,-1,-2. The first two reach +1. The middle two share endpoint zero but differ in whether they reach the threshold.
Exact discrete model, with inventory in units and time in steps. Filled points are the model values; connecting segments guide the eye. Each history has probability 1/4.
A path, an ensemble and a drawing
An ensemble is a collection of possible histories considered together. Monte Carlo simulation generates a finite collection of model paths; looking across their values at a fixed time approximates that time’s distribution. Looking along one path answers a different question. The successive observations in a single history are not automatically independent draws from the fixed-time distribution.
Nor is the mean curve necessarily a possible history. In this example E[Xk]=0 at every model time, yet (0,0,0) is impossible: every step must change inventory by one unit. An average across histories need not describe any individual history.
For a continuous-time model such as Brownian motion, a sample path specifies a value at every time in the interval. A computer usually stores only values on a finite grid. Drawing straight lines between those values adds interpolation, not observations of the intervening motion. A threshold crossing between grid points can be missed; increasing a chart’s pixel resolution does not recover it. Path continuity, jumps and roughness are properties of the model, rather than conclusions established by its plotted connectors.
For the two mathematical readings of a process in an option-pricing setting, see Definition 3.1 of Stochastic Processes, Brownian Motion and Itô’s Lemma. The full lesson requires membership; the linked page provides a public preview.
Sources
Geoffrey Grimmett and David Stirzaker, Probability and Random Processes, 3rd edition, Oxford University Press, 2001, §3.10, “Random walk: counting sample paths.”