The private equity J-curve is the dip and subsequent rise that can appear over a closed-end private equity fund’s life. In a cash-flow chart, the limited partner (LP) pays capital calls before receiving much back. The curve rises when distributions start exceeding calls. The term also describes a dip and recovery in reported investment performance. The cash version helps an LP see how much cash the fund has absorbed at its deepest point. The performance version tracks a return or a multiple. BlackRock, Constructing Optimized Private Equity Programs, pp. 12–13
Follow the cash
A fictional LP pays 40,000 USD at the end of year 1 and another 20,000 USD at the end of year 2. It receives 15,000 USD at the end of year 3 and 55,000 USD at the end of year 4. These are the only cash movements in the example. At each date, cumulative net cash is total cash received minus total cash paid.
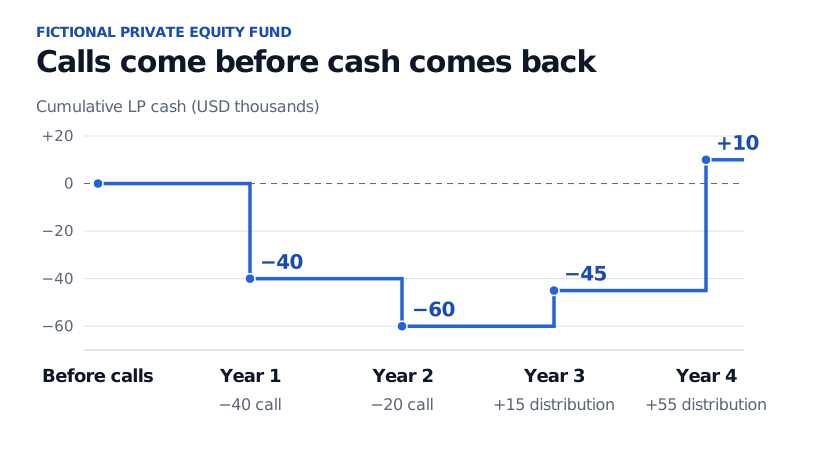
The first distribution lifts the curve while the LP is still 45,000 USD short of recovering its contributions.
The trough comes in year 2, when the LP has paid 60,000 USD and received nothing back. By year 4, distributions total 70,000 USD, so cumulative cash is positive by 10,000 USD. For commitment pacing, an LP can project calls and distributions separately across funds. Later exits can keep cash tied up for longer, and smaller distributions can leave cumulative cash below zero through liquidation. Takahashi and Alexander, Illiquid Alternative Asset Fund Modeling
Read the axis before reading the dip
While a fund still holds investments, since-inception net IRR uses dated cash flows and treats the reporting-date net asset value (NAV) attributable to investors as a terminal value. Net TVPI, or total value to paid-in capital, adds that NAV to cumulative distributions and divides by paid-in capital. Early fees and expenses can weigh on reported performance before gains in the holdings offset them. A change in valuation can move both measures even when the LP receives no cash. ILPA, Performance Template Definitions, pp. 2, 7–8 · BlackRock, pp. 12–13
Suppose the LP’s share of NAV just after the year 3 distribution is 51,000 USD. Its net TVPI is times paid-in capital, while cumulative cash is still −45,000 USD.