A mortality table assigns probabilities of dying or surviving by age for a defined group. Actuaries use those probabilities to value payments that depend on whether someone is alive. A death benefit is weighted by the chance of dying during its coverage period. A life annuity payment is weighted by the chance of being alive on its payment date.
The entry is the conditional probability of dying before age given survival to exact age . The chance of reaching the next birthday from there is . Each row has its own starting group. Office for National Statistics, guide to life tables, §§3–4.
Who reaches the second year?
Take two deliberately stylised table entries, and , with left unspecified. Out of 100 people alive at issue, the model puts 90 alive after year one. The second-year rate applies to those 90. Of them, 18 die and 72 remain alive.
The survival function from issue gives and . A death in year two requires both reaching year two and dying during it, so its probability from issue is .
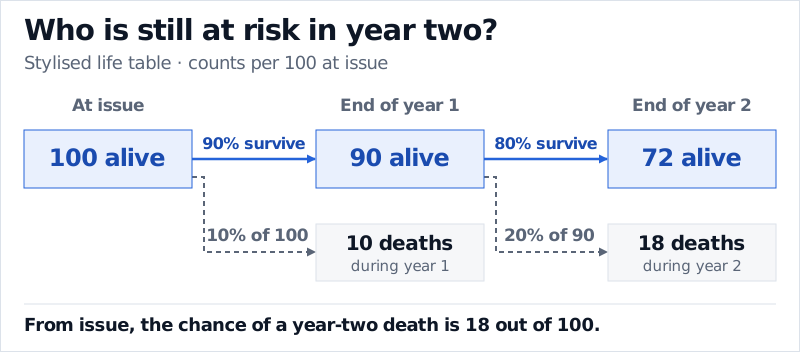
The death branches use the number alive at the start of each year. Relative to the 100 lives at issue, the three final outcomes have weights of 10%, 18% and 72%.
Price the event that triggers payment
Suppose a two-year term policy pays 100 currency units at the end of the policy year in which the insured dies. Coverage stays in force for the two years or until death. Use a flat 5% annual effective discount rate and value the benefit at issue. The expected present value is
A two-year annuity that pays 100 at each year-end if the person is alive then uses the survival weights instead. Under the same discounting assumptions its expected present value is
These values cover the expected cost of benefits at issue. In setting an actual premium, an insurer also considers expenses, policyholder behaviour, the cost of capital and profitability targets. Actuarial Standards Board, ASOP No. 54, §§3.1–3.4.
Which mortality rates go into the model?
A period table uses age-specific rates from the same period. For someone aged in calendar year , it uses year- rates at both age and age . A cohort table follows a birth group as it ages, using the rate at age in year and the rate at age in year . Future rates in a cohort table depend on projections. Mortality improvement means a decline in the death probability at a given age over calendar time. A person's death probability can still rise as they age. If more annuitants survive than the insurer allowed for, more payments fall due. That exposure is longevity risk. Office for National Statistics, guide to life tables, §§1–3.
Insurers also account for selection. Newly underwritten policyholders may have different mortality from people of the same age who have held their policies for years. In a select-and-ultimate table, early-duration rates distinguish age at issue and time since underwriting. After the select period, the ultimate rates use attained age within the relevant risk class. The choice of population and underwriting class matters even when the age and calendar year match. Society of Actuaries, 2015 Valuation Basic Table Report, §§II and V.H.
The Probability Fundamentals lesson works through how conditioning changes the denominator. The full lesson is available with a free account.